A transcript of BBC World Service Radio’s Newsday interview with Keith Booher, PhD, of Zymo Research Corporation about their DNAge® test being used to determine the age of refugees seeking asylum in Europe as minors.
BBC: Could a finger prick test for blood make it easier for child refugees to have their age verified? That’s a question that California scientists have been thinking about. The field is known as Epigenetics and the test involves examining chemically modified DNA to create a sense of how old someone actually is. Keith Booher is a scientist in California and he has been part of the development of this device.
Booher: What we’re simply trying to do is to make an age determination or quantify aging. For example, in forensics cases when the provenance or age of a sample is unknown, we can make that assessment. There’s also some indications that it may be useful for biologically aging someone – so they may have been born 45 years ago, and are 45 years old but based on certain life decision they make – the diet they choose to eat, if they get enough exercise, do they live a stress-free lifestyle? Their biological age may be older or younger than their chronological age, just depending on the lifestyle they lead. And we should be able to quantify that as well.
BBC: So if I asked you now, how old you are, Keith, what would you tell me?
Booher: I’m 38 years old.
BBC: But that’s the chronological age, is that right?
Booher: Correct!
BBC: Which one is more important, biological or chronological?
Booher: You know, if you’re a young teenager trying to get your driver’s license, obviously your chronological age is very important. But if you are in advanced years of your life or you may have made some choices that are… poor when you were younger or over the course of your life, then biological age becomes much more critical.
BBC: How did you end up using your science with refugees?
Booher: Our information was passed to law enforcement officials working in Germany. And they had a case where they were trying to accurately determine the age of a refugee asylum seeker and they determined that the methods available to them at that time were not precise enough to get a good age determination and they reached out to us and asked if we could help.
BBC: What have you found in the course of your work? How accurate is your science at the moment?
Booher: Currently, epigenetic clocks are the most accurate, most precise way to age a sample. So our platform that we offer at Zymo Research has a median error of under two years – it’s about one and a half years. Other publications, people using different types of methods – you know, similar epigenetic aging, have shown median errors anywhere between two to four years. On aggregate, you have a precise age estimation method.
BBC: Has it helped clarify or clear doubt about age?
Booher: Yeah, I think so. In the case of the asylum seeker, I was told this person presented with no official documentation. The person claimed to be a minor, and therefore entitled to certain protections and assistance according to United Nations guidelines. So in this case, I think it definitely helped clear up any doubt regarding the age of the subject.
BBC: I can see it working with football and other sports as well. You know, where there have been all sorts of questions about ages.
Booher: Yeah, that’s correct! That’s a good point. So there’s certain rules about the age of participants engaged in these activities in different leagues.
BBC: Keith Booher from Zymo Research Corporation which is developing Epigenetics.
Autism (autism spectrum disorder) is one of the most common lifelong neurodevelopmental disorders, affecting an estimated 1 in 59 children in the United States 1. Due to its prevalence, autism has become a heavily researched topic in the field of genomics, as medical professionals and advocacy organizations look for a deeper understanding of its wide spectrum of symptoms. Genome-wide studies have suggested the involvement of hundreds of genes and genetic pathways in the development of the disorder. An increased risk of autism development is also known to be influenced by environmental factors such as premature birth, oxygen deprivation, infection during pregnancy, and parental age at time of conception 3. Recent studies have shown that these factors influence what is known as our epigenetics.
But What is Epigenetics?
Epigenetic regulation – in the form of DNA methylation, histone modification, and chromatin remodelling – helps govern the proper expression of genes in the genome. One’s environment continuously shapes their epigenetics. Factors that influence epigenetics can include one’s diet, exercise, stress level, drug abuse, and exposure to toxic pollutants. Failure in epigenetic regulation can result in aberrant gene expression (mutations, deletions, copy number aneuploidies) that contributes to halted neural development 4. Thanks to progresses in Next-Gen Sequencing, scientists have been able to map over 600 human epigenes associated with neurodevelopmental disorders, including autism.
Ongoing Epigenetic Research
Autism research is a continuously growing field, especially in the context of epigenetics. Currently, diagnosis and subsequent treatment is tough due to the degree of heterogeneity of traits those with autism can have. Fortunately, as sequencing technology becomes cheaper, scientists have more opportunities to analyze the epigenome with higher resolution. Without a high price point necessary for entry into autism research, smaller labs now have an opportunity to make significant discoveries.
There are many ongoing studies that aim to understand the epigenetic mechanisms behind the pathogenesis of autism spectrum disorder, as well as possible methods for treatment. A recent exciting study published in Nature Neuroscience demonstrated that mouse models of autism could be rescued via inhibition of histone deacetylase 8. These mice were deficient in the SHANK3 gene, another high-risk target linked to autism spectrum disorder. Mutations in the gene results in dysregulation of emotional and cognitive response in both humans and mice. The researchers found that low-dose treatment by anti-cancer drug romidepsin, a histone deacetylase inhibitor, fully restored gene function and completely reversed the social deficits of the mice after 3 days. This effect lasted 3 weeks in the mice, equivalent to the length of many years in humans.
Why Autism Research Is Important
Research that continues to find links between autism and epigenetics provides clues to the cause and mechanisms of the disorder, as well as invaluable biomarker discoveries. While it is currently thought that there is no single underlying cause of autism, epigenetic biomarkers can be used for risk assessment prior to diagnosis, diagnosis of the disorder itself, or even provide insight into its severity 9.
Studies show that early intervention leads to positive outcomes later in life for people with autism 1. By furthering research on such a prevalent disorder, we can better prepare families at an earlier timepoint. Considering autism’s broad range of characteristics, scientific findings into the disability may also provide insight into the inner workings of other related neurodevelopmental disorders.
Citations:
1. https://www.autismspeaks.org/what-autism 2. Hans van Bokhover. “Genetic and epigentic networks in intellectual disabilities”. Annual Review of Genetics, 2011. 45: 81-104 3. https://www.autismspeaks.org/environmental-factors-autism 4. Michelle Siu and Rosanna Weksberg. “Epigenetics of Autism Spectrum Disorder”. Neuroepigenomics in Aging and Disease, 2017. 978: 63-90 5. Luikenhuis, S., et al. “Expression of mecp2 in postmitotic neurones rescues rett syndrome in mice”. Proc Natl Acad Sci USA, 2004. 101: 6033-6038 6. Samaco, RC., et al. “Epigenetic overlap in autism-spectrum neurodevelopmental disorders: mecp2 deficiency cuases reduced expression of UBE3A and GABRB3”. Hum Mol Genet, 2005. 14: 483-492 7. Wong, C., et al. “Epigenome-wide DNA methylation analysis of monozygotic twins discordant for diurnal preference”. Twin Res Hum Genet, 2015. 18: 662-669 8. Qin, L., et al. “Social deficits in shank3-deficient mouse models of autism are rescued by histone deacetylase inhibition”. Nature Neuroscience, 2018. 21: 564-575 9. Loke, Yuk Jing, et al. “The role of epigenetic change in autism spectrum disorders”. Front Neurol, 2015. 6: 107
Their songs haunt the deepest depths of the ocean and their behaviors have intrigued scientists for generations. The humpback whale itself is a mystery in many ways, such as having no real visible age indicators after they are one year old.
Studying the age characteristics of sensitive animal populations can provide valuable ecological insights into questions of reproductive success, lifespan, survival trends, and more. In recent decades, marine biologists have used different methods to measure age in certain whale species. However, most have notable limitations.
Limitations
For example, the age of deceased whales can be estimated using various invasive biopsy techniques, but doing so precludes the monitoring of living subjects over time. Alternatively, researchers attempted to measure the age of live whales using telomeric genetic markers, but those methods suffer from a lack of specificity and too much technical noise. By contrast, a number of recent research articles demonstrated that DNA methylation-based age estimators, commonly referred to as epigenetic clocks, are a highly accurate and technically robust means to measure aging in mammalian species as diverse as mice, canines, humans, and other primates1-3.
A group of researchers in Australia now show that DNA methylation analysis is an effective way to help predict the age of living whale populations, thus providing a new tool to study the demographics of these majestic ocean leviathans.
In their study, Polanowski et al.4 noted the development of DNA methylation-based age clocks and set out to develop a similar test for use in humpback whale (Megaptera novaeangliae) research. They focused on the evolutionarily conserved 5’ regulatory regions of genes whose changing DNA methylation patterns correlated with age. The authors first generated a calibration data set using a cohort of 45 humpback whales originating primarily from the Gulf of Maine and with known ages ranging from a few months up to 30 years. Importantly, the tissue sample source used in the analysis came from minimally invasive skin punch dart biopsies.
Humpback Epigenetic Age Assay (HEAA)
The scientists called their new experimental tool the Humpback Epigenetic Age Assay (HEAA). Application of their 3-gene test demonstrated a high positive correlation (R2 = 0.787) between DNA methylation change and age. Furthermore, a leave-one-out cross validation from the calibration cohort data set demonstrated precision and accuracy (Mean difference = 3.75 years; Standard deviation = 2.991 years) between the predicted and known ages of the samples.
Having established the HEAA, Polanowski et al. then set out to test their model on a humpback whale population of unknown age composition. Using skin biopsies once again, they measured the epigenetic ages of 63 humpback whales migrating north near Evans Head, Australia, and observed an average population age of 10 years, with a total age range from 0 to 52 years.
The authors further noted that the distribution of the measured ages resembled what would be expected for a sample population of that size and in that region after comparing their dataset to one obtained in the same area 50 years earlier, before the effects of whaling caused the fishery to collapse in the 1960s. One final test of the HEAA showed its ability to correctly pick the ordinal age-relationship between parent and progeny in both data simulations (<90% accuracy) as well as an empirical test of mother-calf pairs taken from the test and calibration data sets, respectively. The assay proved accurate in all 12 pairings tested.
With the HEAA, Polanowski et al. present an epigenetic clock similar to what has been shown to work so effectively in other mammalian species. Initial calibration and testing of the HEAA demonstrated its broad precision, accuracy, robust nature, and compatibility with a minimally invasive and readily obtainable sample source. Continued use of the HEAA, or similar DNA methylation-based age estimators, will help scientists track the overall health of whale populations well into the 21st century.
Citations:
[1] Horvath S. DNA methylation age of human tissues and cell types. Genome Biology. 2013;14(10): R115. doi:10.1186/gb-2013-14-10-r115. [2] Petkovich DA, Podolskiy DI, Lobanov AV, Lee SG, Miller RA, and Gladyshev VN. Using DNA methylation profiling to evaluate biological age and longevity interventions. Cell Metabolism. 2017;25(4);954-960.e6. doi:10.1016/j.cmet.2017.03.016. [3] Thompson MJ, vonHoldt B, Horvath S, and Pellegrini M. An epigenetic aging clock for dogs and wolves. Aging. 2017;9(3):1055-1068. doi: 10.18632/aging.101211. [4] Polanowski AM, Robbins J, Chandler D, and Jarman SN. Epigenetic estimation of age in humpback whales. Mol Ecol Resour. 2014;14(5):976-87. doi: 10.1111/1755-0998.12247.
Of the several chemical and structural modifications to DNA that are known to influence gene expression, 5-methylcytosine (5-mC), has garnered the most attention because of its role in transcriptional silencing and the readily available techniques to investigate it. For instance, bisulfite sequencing via short-read Next Generation Sequencing (NGS) has become the gold-standard for 5-mC detection due to its single-nucleotide resolution and the ever-decreasing cost of whole genome sequencing. The pairing of bisulfite to NGS has greatly expanded our understanding on the extent of cytosine methylation influence on gene expression.
But, the application of NGS technologies to analyze the genomes of complex microbial communities (e.g. microbiome and metagenomic samples) has caused other DNA modifications to gain more attention. For example, N6-methyladenine (m6A) plays important roles in bacterial survival and interactions with hosts 1. Like other epigenetic base modifications, m6A contributes to the regulation of gene expression as well other house-keeping functions in bacteria. Unfortunately, methylation detection by short-read bisulfite sequencing is based on cytosine to uracil conversion and cannot detect adenine modifications, such as m6A.
This is why many researchers are turning to long-read sequencing platforms (3rd generation sequencing technology), since they use differences in electronic signals as bases to pass through nanopores and detect other types of base modifications. Like any new technology, methylation detection with 3rd generation sequencing needed benchmarking with the use of well-defined standards and controls.
Not one, not two, but four sequencing platforms!
While the use of one sequencing platform is sufficient for most studies, some researchers incorporate two sequencing methods when verifying a new bioinformatics tool. However, to validate a new N6- methyladenine (m6A) detection tool named mCaller, McIntyre, et al. sequenced the ZymoBIOMICS Microbial Community Standard using PacBio, Oxford Nanopore, MeDIP-seq and whole-genome bisulfite sequencing 1. Single-molecule sequencing techniques, such as PacBio 2 and Oxford Nanopore Technologies (ONT) 3 have been used to detect m6A, but no method has had cross-validated results by using a well-characterized reference material on several sequencing platforms – until now.
Older m6A detection methods based on immunoprecipitation were limited in terms of nucleotide resolution, while previous single-molecule sequencing detection tools suffered from lower base modification calling (~70%) 3, 4. To improve accuracy, mCaller employs a neural network to learn and test different classifiers to detect m6A in Nanopore data generated from the E. coli MG1655 (a K-12 strain) genome.
To validate the tool, the bacterial genomes of the ZymoBIOMICS microbial community standard were sequenced via ONT, PacBio, and MeDIP-seq, and mCaller detection accuracy was compared across the different data sets. Remarkably, detection accuracy increased to 84.2% for high quality reads, and even 95.4% for single sites with at least 15x coverage, when compared to immunoprecipitation methods. Additionally, the methylome of the standard was verified with the use of the TruSeq DNA Methylation Kit.
Regulatory-Grade Genomes
As an additional control, the PacBio sequencing of the ZymoBIOMICS Microbial Community Standard was performed at two separate locations: the University of Florida and the Database for Reference Grade Microbial Sequences (FDA-ARGOS). The goal of FDA-ARGOS is to create a database of reference-grade microbial sequences available to the public. Because the sequencing of the ZymoBIOMICS Microbial Community Standards met the FDA-ARGOS quality requirements, they have been accepted as regulatory-grade genomes with the designations of FDARGOS_606 and FDAARGOS_612 under the BioProject number PRJNA477598.
“Overall, our results demonstrate a need for tool evaluation at a variety of sequence contexts, for which we propose the continued use of this well-validated microbial reference community.” – McIntyre, et al.
Team work makes the dream work
Although the ZymoBIOMICS Microbial Community Standard was developed as microbiome reference material, its well-defined and characterized composition has made it an excellent control for epigenetic sequencing. Such a cross-discipline use of reference materials and sequencing techniques demonstrates the power of inter-lab cooperation and the ability for different field leaders to push the capabilities of current technology.
[1] McIntyre ABR, Alexander N, Grigorev K, Bezden D, Sichtig H, Chiu CY, Mason CE. Single-molecule sequencing detection of N6-methyladenine in microbial reference materials. Nature Communications. 2019 10 (579). [2] Fang G, Munera D, Friedman DI, Mandlik A, Chao MC, Banerjee O, Fengg Z, Losic B, Mahajan MC, Jabado OJ, Deikus G, Clark TA, Khai L, Murray IA, Davis BM, Keren-Pas A, Chess A, Roberts RJ, Korlach J, Turner SW, Kumar V, Waldor MK, Schadt EE. Genome-wide mapping of methylated adenine residues in pathogenic Escherichia coli using single-molecule real-time sequencing. Nature Biotechnology 2012 30(12) [3] Stoiber M, Quick J, Egan R, Lee JE, Celniker S, Neely RK, Loman N, Pennacchio LA, Brown J. De novo Identification of DNA Modifications by Genome-Guided Nanopore Signal Processing. BioRxiv 2017. doi: https://doi.org/10.1101/094672 [4] Rand AC, Jain M, Eizenga JM, Musselman-Brown A, Olsen HE, Akeson M, Paten B. Mapping DNA methylation with high-throughput nanopore sequencing. Nature Methods 2017 14(4)
CONTROLS FOR METHYLATION ASSAYS: HOW, WHEN & WHY TO USE THEM
All scientific experiments need controls. Specific controls are required for certain type of experiments, such as DNA methylation assays. DNA methylation is a powerful, well-studied epigenetic mark that continues to provide extensive insight into transcription regulation, embryonic development, genome stability, and chromatin structure. Changes in DNA methylation profiles have also been linked to the development of many diseases 1. Many clinical applications have utilized DNA methylation as a biomarker for early detection, diagnostics, and personal therapy 2, 3. This requires accurate characterization of methylation patterns at a specific region or single-base level.
Most commonly used DNA methylation assays include bisulfite sequencing using NGS technologies, methylation-specific PCR (MSP), and methylation-sensitive restriction enzyme (MSRE) assays. To minimize bias in quantifying methylation levels, especially in clinical applications, each assay needs to be carefully designed and optimized to ensure its robustness4. Integrating established controls is key for optimizing assays and monitoring assay’s effectiveness . For optimization of DNA methylation assays, it is best to use established DNA standards with known methylation levels. Typically, this requires a methylated and non-methylated DNA standard, which contain nearly 100% and 0% methylation, respectively, at all CpG sites. The use of these two standards individually or in combination can help identify potential biases in assay development. For established workflows, these standards can serve as a positive and negative control to validate the procedures and results, which is essential in clinical testing to enhance quality control and assurance.
QUALITY CONTROLS FOR VALIDATING DNA METHYLATION ASSAY WORKFLOWS
As a good practice, methylated and non-methylated standards should be processed in parallel to experimental samples as a quality control for the whole workflow. In contrast to standards that are expected to produce a consistent result each time, experimental samples can have many variables, making troubleshooting difficult. In PCR-based and NGS-based DNA methylation assays, inhibitors carried over from the samples, primer design, enzymatic reagents, instrument failures, and many other factors can cause an assay to fail. Data produced by the standards can suggest where to start troubleshooting. For example, if standards perform as expected when run in parallel with experimental samples which perform poorly, the workflow is functioning properly, suggesting the experimental sample quality may be an issue. If standards did not perform as expected, there may be an issue within the workflow that caused the assay to fail.
CONTROLS FOR OPITIMIZING AND CALIBRATING BISULFITE-BASED ASSAYS
Bisulfite PCR (BSP) is a common methodology used for methylation analysis at single-base resolution. Samples are first bisulfite converted and amplified using bisulfite-specific primers. The PCR products generated are sequenced (i.e. Next-Gen Sequencing, Sanger Sequencing, pyrosequencing) and analyzed to determine the methylation status at every cytosine. However, it is critical that primer pairs designed for BSP amplify both methylated and non-methylated sequences with the same efficiency (Figure 1). Otherwise, any amplification bias can result in skewed methylation levels.
Using methylated and non-methylated DNA controls, BSP primers can be easily optimized (validated) based on following criteria:
+Specific product amplification
+Equally robust amplification of both methylated and non-methylated DNA standards
+When sequenced, the methylated and non-methylated DNA standards should result in nearly 100% and 0% methylation, respectively. If the results deviate from the expected result, this may indicate PCR bias.
Figure 1. Bisulfite PCR primers should show equally efficient amplification of methylated, non-methylated, or partially methylated templates. Equal amounts of bisulfite converted non-methylated and methylated DNA controls were amplified in parallel with experimental samples using primers designed to target MGMT. Observed bands for methylated and non-methylated templates are of equal intensity, indicating that the primer pair is unbiased.
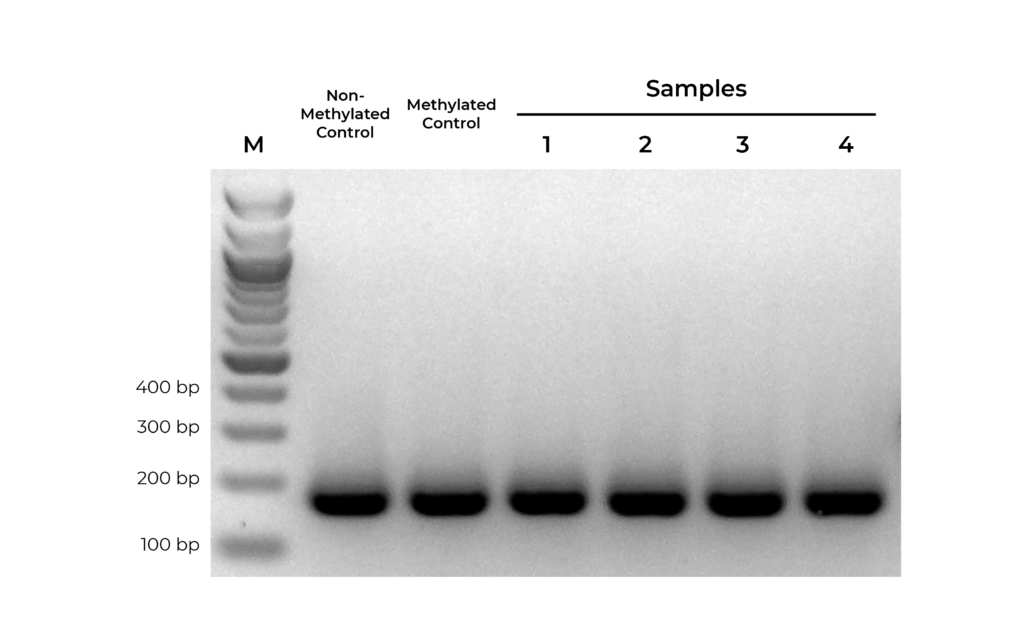
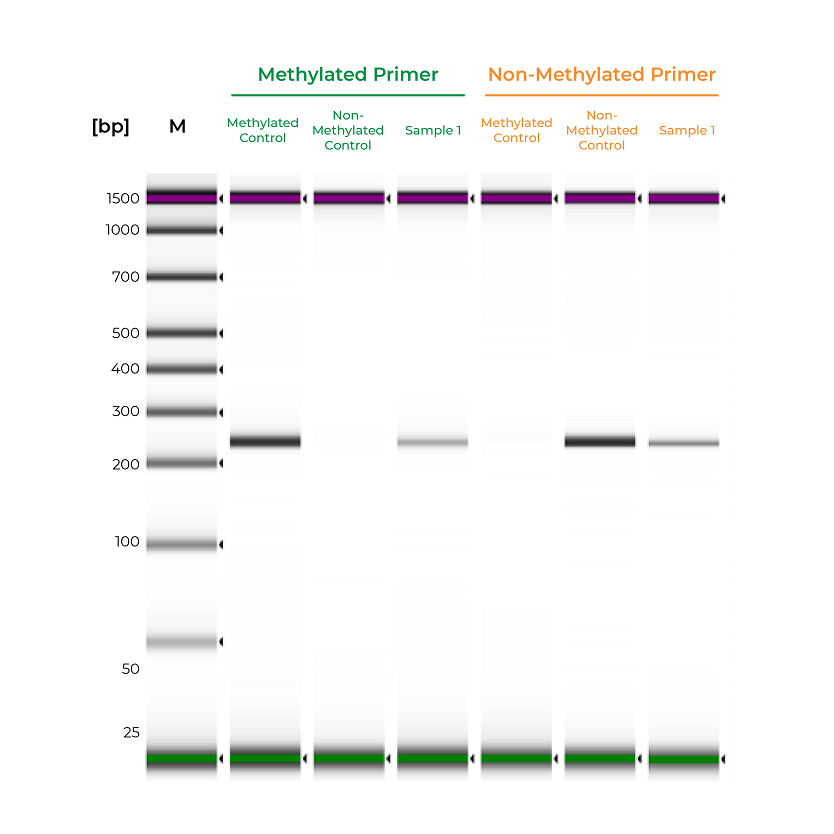
Unlike bisulfite PCR, methylation-specific PCR (MSP) requires methylated and non-methylated templates to be differentially amplified by two different primer sets. One is a methylation-specific primer set, and if amplification occurs, it indicates the amplified region is completely methylated. The second primer set targets non-methylated templates, so any amplification with this primer set indicates the amplified region is completely non-methylated. If amplicons are generated by both primer sets, the region is partially methylated.
#The methylated primer will only amplify the methylated control DNA and will not amplify the non-methylated DNA.
#The non-methylated primer will only amplify the non-methylated control DNA and will not amplify the methylated DNA.
During primer validation, having characterized methylated and non-methylated DNA standards can streamline the process. For example, if a slight PCR signal is observed using the methylated standard with the non-methylated primers, or vice versa, it would indicate that the primer set is non-specific. For established workflows, especially in clinical assays, methylated and non-methylated DNA standards can serve as positive and negative controls to validate the MSP workflow. Standards will help confirm that the entire process – bisulfite conversion, amplification, and analysis – are functioning appropriately, and the results for the test samples are reliable (Figure 2).
Figure 2. Methylated and non-methylated controls are important for validating the sensitivity of MSP assays. The methylated and non-methylated controls are only amplified by the methylated and non-methylated primers, respectively. Sample 1 is amplified by both primer sets, indicating mixed methylation. Samples were analyzed on the Agilent D100 ScreenTape.
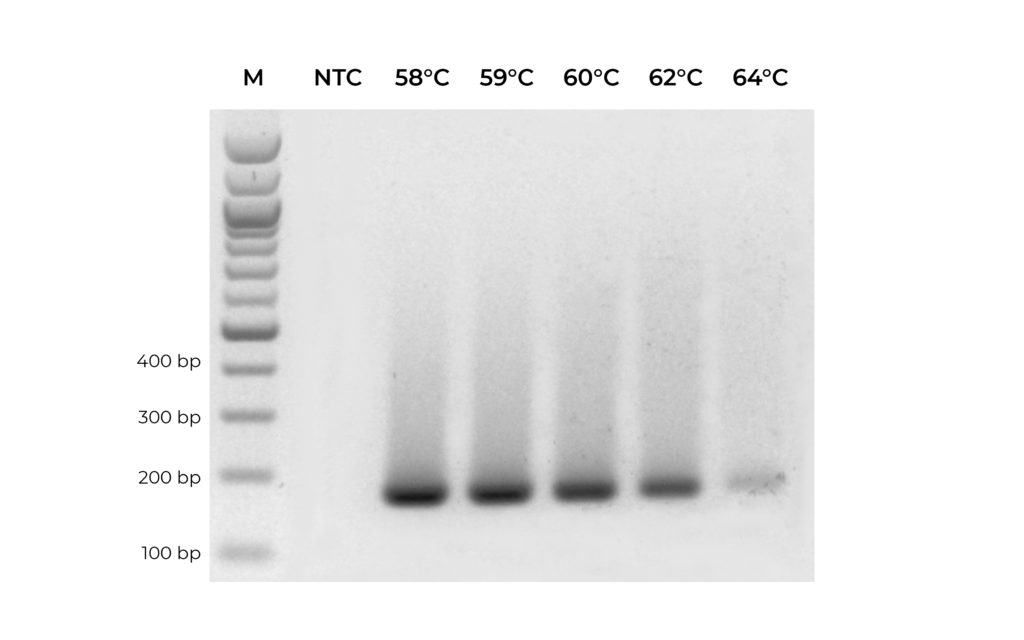
In addition to validating primers, DNA standards can be used in place of precious samples to optimize the annealing temperature for new primer sets (Figure 3). An annealing temperature gradient should be performed for each newly designed primer set to ensure optimal amplification of the intended target.
Figure 3. A primer set targeting MGMT was optimized by testing replicate PCR reactions with annealing temperature ranging from 58°C to 64°C.
CONTROLS FOR METHYLATION SENSITIVE RESTRICTION ENZYME (MSRE) ASSAYS
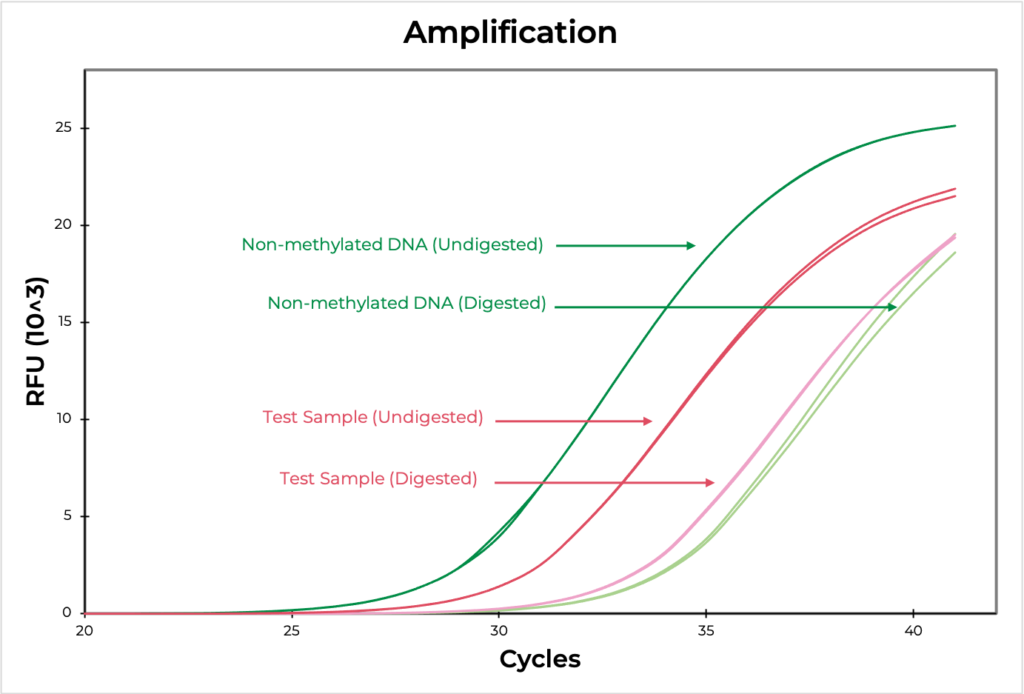
Methylation sensitive restriction enzyme (MSRE) assays rely on restriction enzymes being able to distinguish methylated versus non-methylated cytosines. If the restriction site is not methylated, the enzyme will digest the DNA while methylated sites will be uncut. Then, methylation at the site can be evaluated using quantitative PCR by comparing the amplification of the digested versus undigested sample. The smaller the ∆C(t) between the two, the higher the methylation levels are, and vice versa (Figure 4). DNA visualization methods, such as an agarose gel, can also be used to determine if the digestion occurred at the region of interest.
Methylated and non-methylated DNA standards should be digested in parallel to experimental samples to demonstrate the robustness of the restriction enzyme in distinguishing methylated versus non-methylated sites. This will also help determine the sensitivity of the assay to the region of interest.
Figure 4. The amplification curve demonstrates the differences in Ct values between digested and undigested samples. The MSRE assay detected 100.9% and 2.7% methylation in the methylated and non-methylated DNA standards, respectively, confirming that the assay worked efficiently. The test sample methylation level was determined to be 17.3.
DNA STANDARDS FOR OTHER APPLICATIONS
DNA standards can be used for optimizing a variety of other applications as it is high-quality genomic DNA with known methylation patterns. This makes them ideal substitutes for precious DNA or problematic sample types when titrating experimental conditions. For example, when optimizing bisulfite library preparation of FFPE DNA, the DNA standards can easily be sonicated or fragmented to be representative of the experimental samples.
The methylated and non-methylated DNA standards have been adapted as controls for numerous methylation assays:
The Human Methylated & Non-methylated DNA Standards are an example of a validated control set for methylation analysis of human samples. They have been widely used for all the assays mentioned above and much more. Zymo Research also provides a range of other DNA standards that can be used for optimization or quality controls for other assays to help guarantee your data is of the highest quality and ready for publication.
References:
1. Robertson, K. D., DNA methylation and human disease. Nat Rev Genet 2005, 6 (8), 597-610. 2. Roy, D.; Tiirikainen, M., Diagnostic Power of DNA Methylation Classifiers for Early Detection of Cancer. Trends Cancer 2020, 6 (2), 78-81. 3. Wick, W.; Weller, M.; van den Bent, M.; Sanson, M.; Weiler, M.; von Deimling, A.; Plass, C.; Hegi, M.; Platten, M.; Reifenberger, G., MGMT testing–the challenges for biomarker-based glioma treatment. Nat Rev Neurol 2014, 10 (7), 372-85. 4. Hernández, H. G.; Tse, M. Y.; Pang, S. C.; Arboleda, H.; Forero, D. A., Optimizing methodologies for PCR-based DNA methylation analysis. Biotechniques 2013, 55 (4), 181-97. 5. Olkhov-Mitsel, E.; Zdravic, D.; Kron, K.; van der Kwast, T.; Fleshner, N.; Bapat, B., Novel multiplex MethyLight protocol for detection of DNA methylation in patient tissues and bodily fluids. Sci Rep 2014, 4, 4432. 6. Delgado-Cruzata, L.; Vin-Raviv, N.; Tehranifar, P.; Flom, J.; Reynolds, D.; Gonzalez, K.; Santella, R. M.; Terry, M. B., Correlations in global DNA methylation measures in peripheral blood mononuclear cells and granulocytes. Epigenetics 2014, 9 (11), 1504-10. 7. Ribeiro Ferreira, I.; Darleans Dos Santos Cunha, W.; Henrique Ferreira Gomes, L.; Azevedo Cintra, H.; Lopes Cabral Guimarães Fonseca, L.; Ferreira Bastos, E.; Clinton Llerena, J.; Farias Meira de Vasconcelos, Z.; da Cunha Guida, L., A rapid and accurate methylation-sensitive high-resolution melting analysis assay for the diagnosis of Prader Willi and Angelman patients. Mol Genet Genomic Med 2019, 7 (6), e637. 8. Rajić, J.; Inic-Kanada, A.; Stein, E.; Dinić, S.; Schuerer, N.; Uskoković, A.; Ghasemian, E.; Mihailović, M.; Vidaković, M.; Grdović, N.; Barisani-Asenbauer, T., Infection Is Associated with E-Cadherin Promoter Methylation, Downregulation of E-Cadherin Expression, and Increased Expression of Fibronectin and α-SMA-Implications for Epithelial-Mesenchymal Transition. Front Cell Infect Microbiol 2017, 7, 253. 9. Rawluszko, A. A.; Bujnicka, K. E.; Horbacka, K.; Krokowicz, P.; Jagodziński, P. P., Expression and DNA methylation levels of prolyl hydroxylases PHD1, PHD2, PHD3 and asparaginyl hydroxylase FIH in colorectal cancer. BMC Cancer 2013, 13, 526. 10. Sparago, A.; Verma, A.; Patricelli, M. G.; Pignata, L.; Russo, S.; Calzari, L.; De Francesco, N.; Del Prete, R.; Palumbo, O.; Carella, M.; Mackay, D. J. G.; Rezwan, F. I.; Angelini, C.; Cerrato, F.; Cubellis, M. V.; Riccio, A., The phenotypic variations of multi-locus imprinting disturbances associated with maternal-effect variants of NLRP5 range from overt imprinting disorder to apparently healthy phenotype. Clin Epigenetics 2019, 11 (1), 190. 11. Yu, W.; Qin, X.; Jin, Y.; Li, Y.; Santiskulvong, C.; Vu, V.; Zeng, G.; Zhang, Z.; Chow, M.; Rao, J., Tianshengyuan-1 (TSY-1) regulates cellular Telomerase activity by methylation of TERT promoter. Oncotarget 2017, 8 (5), 7977-7988. 12. Van der Auwera, I.; Yu, W.; Suo, L.; Van Neste, L.; van Dam, P.; Van Marck, E. A.; Pauwels, P.; Vermeulen, P. B.; Dirix, L. Y.; Van Laere, S. J., Array-based DNA methylation profiling for breast cancer subtype discrimination. PLoS One 2010, 5 (9), e12616. 13. Rauen, T.; Grammatikos, A. P.; Hedrich, C. M.; Floege, J.; Tenbrock, K.; Ohl, K.; Kyttaris, V. C.; Tsokos, G. C., cAMP-responsive element modulator α (CREMα) contributes to decreased Notch-1 expression in T cells from patients with active systemic lupus erythematosus (SLE). J Biol Chem 2012, 287 (51), 42525-32. 14. Zheleznyakova, G. Y.; Nilsson, E. K.; Kiselev, A. V.; Maretina, M. A.; Tishchenko, L. I.; Fredriksson, R.; Baranov, V. S.; Schiöth, H. B., Methylation levels of SLC23A2 and NCOR2 genes correlate with spinal muscular atrophy severity. PLoS One 2015, 10 (3), e0121964.
In the constantly improving field of clinical diagnostics, a revolution is occurring in the form of liquid biopsies and cell-free nucleic acid (cfNA) analysis. Liquid biopsies are a non/less-invasive method to analyze health status from biological fluid samples (serum, saliva, urine, and other fluid sample types). Typically, they require small amounts of starting material (<10 mL), are minimally-invasive and simple to perform. Compared to liquid biopsies, surgical biopsies can be very invasive, time consuming, painful, and are limited in scope.
The significance of liquid biopsies lies in their ability to detect early disease with just a simple blood draw. As technologies improve the detection of specific disease biomarkers, earlier adoption of more effective targeted treatments is possible. This potential has been gaining a lot of attention, leading to significant investments by companies like Illumina and Roche.
Cell-free Nucleic Acids
It has long been recognized that biological fluids contain DNA and RNA that is not contained in cells. It is now known that these cell-free nucleic acids are released into biological fluids from apoptotic and necrotic cells or secreted from healthy and diseased cells via microvesicles such as exosomes [1]. The presence of cfNA in biological liquids has been long recognized, but its function is poorly understood, as practical uses have been hampered by insufficient isolation and analytical methods [2]. For example, cfNAs have been linked to cancer since their discovery in 1948 [3], but due to technical limitations, it took almost 20 years for a link between cell-free DNA (cfDNA) and cancer to be established and widely supported.
It took another 20 years to define tumor-derived cfDNA within samples taken from cancer patients [4]. However, with the inception of the Human Genome Project and recent technological advances in genome analysis, the field of cell-free nucleic acid research has grown rapidly and cell-free RNA (cfRNA) analysis is starting to gain recognition as a source of important biomarkers [5].
The use of cell-free nucleic acid detection has expanded beyond cancer detection. Liquid biopsy methods are now being evaluated for diagnostic effectiveness in disease and pre-natal genetic testing. If proven effective, these techniques will allow for safer and earlier in vivo detection of various inherited genetic diseases. The goal is to implement personalized medical interventions in early stages of disease for a better chance of positive effects on health outcomes. Many tests already widely used with cell-free fetal DNA (cffDNA) include a first trimester Down syndrome screen, amniotic fluid analysis, and chromosomal karyotype analysis.
Many applications are currently being evaluated as a less-invasive method to monitor patient health. These include testing for fetal aneuploidy, monitoring the status of organ transplants, blunt trauma and burn recovery progression, and detection of sepsis and septic shock in patients [6]. In addition to these, research is underway to use cfNA for early diagnosis of genetic disorders such as β-thalassemia and sickle cell anemia [6]. Earlier detection will lead to earlier treatment of many of these disorders, which will improve treatment outcomes and prevent comorbidities from developing.
Sample Diversity and Purification Issues
Numerous biofluids such as blood, cerebrospinal fluid (CSF), saliva, amniotic fluid, and urine [4, 6-9] contain readily detectable cfNA populations. However, each of these sample sources produce specific challenges during collection, handling, and extraction that must be addressed to obtain accurate profiles. Cell-free DNA is most commonly isolated from the serum or plasma fraction of blood, however extraction methods must also be able to address a wide range of sample types.
The most readily available methods to collect cfDNA have been restricted to commercially available extraction kits or homemade methods. These methods may not be optimized and often use outdated technologies. Cell-free biofluids are challenging to work with due to their high protein content and low amount of cfNA in relatively large amounts of liquid. This is why traditional cfNA extraction technologies have been so limited in isolation efficiency, sample compatibility, and have been unable to isolate both cfDNA and cfRNA from the same input sample.
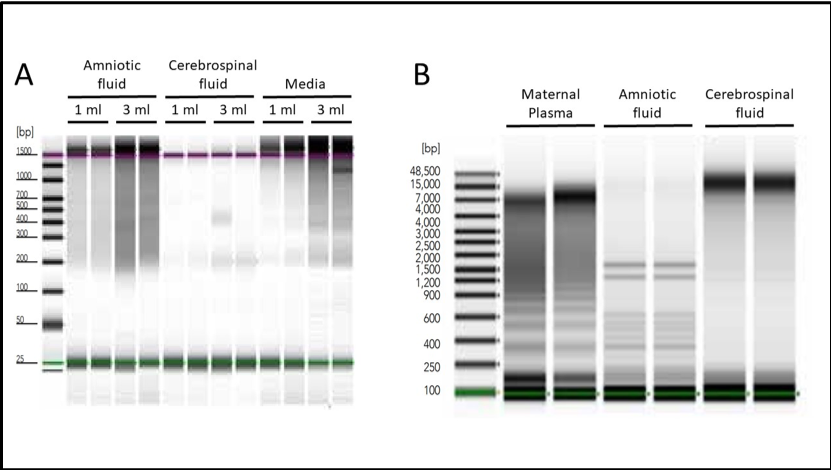
To address this issue, Zymo Research produced a revolutionary kit designed to easily process samples from liquid biopsies, all in one quick, simple workflow. The Quick-cfDNA/cfRNA™ Serum & Plasma Kit contains protocols that make it easy to isolate cfDNA from even the most difficult sample types (Figure 1).
Figure 1: Isolation of cell-free nucleic acids from various sources. A. Amniotic fluid, cerebrospinal fluid, or spent HeLa cell culture media were used to isolate cfNAs using Quick-cfDNA/cfRNA Serum & Plasma Kit. Endogenous cell-free DNA from each sample type was visualized using the Agilent 2200 TapeStation® system. B. Total cfDNA, including both high and low molecular weight species, was purified in duplicate from human maternal plasma, amniotic fluid, and cerebrospinal fluid using the Quick-cfDNA Serum & Plasma kit. DNA was visualized using the Agilent 2200 TapeStation® system.
Cell-free Nucleic Acid Profile Analysi
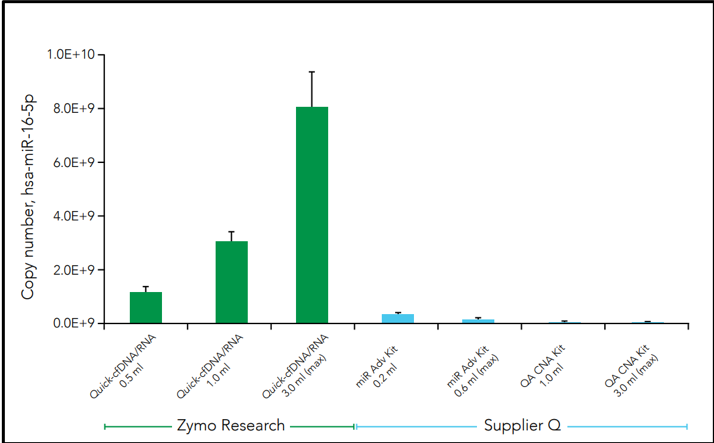
Another challenge facing cfNA analysis is the robustness of samples when initiated into sequencing pipelines such as RNA sequencing (RNA-Seq). Along with the relatively low amount of nucleic acid, microRNAs are often lost during purification which leads to profile bias. This is can be due to the use of non-optimal extraction methods that produce biased cfNA recovery. For example, three commercial methods of cfRNA extraction from plasma demonstrates difference in the cell-free microRNA yield for hsa-miR-16-5p in the figure below (Figure 2).
Figure 2: Cell-free DNA recovery scales proportionally with sample input. Cell-free DNA was isolated in duplicate from three healthy female donors using the Quick-cfDNA Serum & Plasma kit and visualized using the Agilent 2200 TapeStation® system.
Cell-free Nucleic Acid Profile Analysis
Another challenge facing cfNA analysis is the robustness of samples when initiated into sequencing pipelines such as RNA sequencing (RNA-Seq). Along with the relatively low amount of nucleic acid, microRNAs are often lost during purification which leads to profile bias. This is can be due to the use of non-optimal extraction methods that produce biased cfNA recovery. For example, three commercial methods of cfRNA extraction from plasma demonstrates difference in the cell-free microRNA yield for hsa-miR-16-5p in the figure below (Figure 3).
Figure 3: Isolation of human miR-16-5p using commercially available cfNA extraction kits. Samples from the same donor (plasma from 61y-F) were processed using the manufacturers’ suggested protocol and eluted in 30 µl. Quantification of human hsa-miR-16-5p was assayed using the method described by Busk [10]. The yield scales linearly to input volume for Quick-cfDNA/cfRNA Serum & Plasma Kit.
Delicate Yet Difficult
While the information provided by this RNA/DNA ratio is critical to understanding the risks posed by environmental stress, purifying DNA and RNA from coral sample can be tricky. Coral tissues contain strong collagen fibers, which can make cells lysis difficult. However, high-quality DNA and RNA can still be isolated and purified from coral tissue with special considerations. For example, it is suggested to remove as much skeleton as possible from the coral tissue in order to minimize the possible effects of endolithic organisms.
Below are a few recommended protocols for processing coral samples.
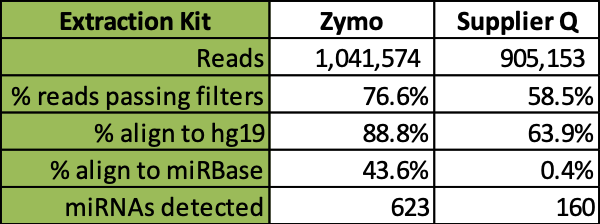
Further comparative analysis of commercial kit cfRNA extracts followed by RNA-seq analysis demonstrates that the Quick-cfRNA Serum & Plasma kit yielded higher quality reads, better alignment to sequence databases, and achieved recovery of 463 additional microRNA species not recovered by the supplier Q kit (Table 1).
Table 1: Comparison of RNA-Seq analysis of cell-free microRNAs from two commercial kit workflows. Total cell-free RNAs were isolated from 200 µl plasma from each of four different donors. RealSeq-Biofluids Library Prep Kit (SomaGenics) was used to generate RNA sequencing library and ran on MiniSeq System (Illumina). Read averages, quality, alignments, and microRNA diversity quantification are summarized above.
Conclusion
The field of liquid biopsy is rapidly growing due to the massive technological revolution in genomics over the past 30 years. The discovery of cell-free nucleic acids has allowed for doctors to monitor cancer and other disease states in human adults as well as detect complications early on in pregnancy. The advent of analytical methods for cell-free nucleic acid detection has allowed for significantly safer disease monitoring and pregnancy testing. This is because rather than a surgical biopsy or amniocentesis physicians can get all the information from a simple blood draw. With these tools in place, scientists and doctors can work together to bring us to a healthier and safer future through early diagnosis and rapid disease monitoring.
[1] Dominguez-Vigil IG, Moreno-Martinez AK, Wang JY, Roehrl MHA, Barrera-Saldana HA. The dawn of the liquid biopsy in the fight against cancer. Oncotarget. 2018;9:2912-22. [2] Bettegowda C, Sausen M, Leary RJ, Kinde I, Wang Y, Agrawal N, et al. Detection of circulating tumor DNA in early- and late-stage human malignancies. Sci Transl Med. 2014;6:224ra24. [3] Mandel P, Metais, P. Les acides nucléiques du plasma sanguin chez l’homme. C R Seances Soc Biol Fil. 1948;142:241-3. [4] Bryzgunova OE, Laktionov PP. Extracellular Nucleic Acids in Urine: Sources, Structure, Diagnostic Potential. Acta Naturae. 2015;7:48-54. [5] Zaporozhchenko IA, Ponomaryova AA, Rykova EY, Laktionov PP. The potential of circulating cell-free RNA as a cancer biomarker: challenges and opportunities. Expert Rev Mol Diagn. 2018;18:133-45. [6] Soltani M, Nemati M, Maralani M, Estiar MA, Andalib S, Fardiazar Z, et al. Cell-free fetal DNA in amniotic fluid supernatant for prenatal diagnosis. Cell Mol Biol (Noisy-le-grand). 2016;62:14-7. [7] Connolly ID, Li Y, Pan W, Johnson E, You L, Vogel H, et al. A pilot study on the use of cerebrospinal fluid cell-free DNA in intramedullary spinal ependymoma. J Neurooncol. 2017;135:29-36. [8] Hui L, Bianchi DW. Cell-free fetal nucleic acids in amniotic fluid. Hum Reprod Update. 2011;17:362-71. [9] Martin M. Cutadapt removes adapter sequences from high-throughput sequencing reads. 2011. 2011;17:3. [10] Busk PK. A tool for design of primers for microRNA-specific quantitative RT-qPCR. BMC Bioinformatics. 2014;15:29.
In 2016, a silent death wrapped around the Great Barrier Reef off the coast of Australia and drained the color and life from more than half its coral. The event was unprecedented and left researchers around the world with new questions, one more troubling than others. Could these beautiful underwater ecosystems be messengers for something bigger?
Coral Bleaching
Recent effects of climate change have led to a dangerous rise in seawater temperatures which has devastated coral reefs across the globe. Ocean temperatures and pollution can cause stress to the coral which results in the loss of the colorful algae that lives within their tissues in a process called “bleaching.”
Losing the algae results in a loss of the major source of food and energy for the coral and leaves it susceptible to diseases and death. While only occupying 1% of the entire ocean, coral reefs have one of the highest biodiversity in the world and provide habitats for up to 25% of all marine life [1]. Therefore, the impact of environmental changes on coral can be used as a proxy for measuring the health of the ocean.
Genetic Diversity
Genetic diversity and high variability in DNA are critical factors for a species’ capacity for adaption, extinction risk, and resistance to environmental stress. A genomic studyperformed by the Hawaii Reef Connectivity Consortium found that areas exposed more frequently to bleaching effects have decreasing levels of genetic diversity in coral as well as the many inhabitants of the reefs [2]. Current conservation strategies are focused on protecting the genetic diversity of coral and therefore reducing their extinction risk caused by growing climate change.
Taking this further, some researchers use DNA to RNA ratio studies as a biochemical growth-rate indicator for studies of fish and marine invertebrates (including coral) [3]. The ratio is useful because DNA is a fixed amount per cell whereas RNA can vary depending on metabolic need. Therefore, the RNA/DNA ratio may provide a better understanding of the coral populations’ response to environmental stress caused by climate change because of the strain on protein production.
Delicate Yet Difficult
While the information provided by this RNA/DNA ratio is critical to understanding the risks posed by environmental stress, purifying DNA and RNA from coral sample can be tricky. Coral tissues contain strong collagen fibers, which can make cells lysis difficult. However, high-quality DNA and RNA can still be isolated and purified from coral tissue with special considerations. For example, it is suggested to remove as much skeleton as possible from the coral tissue in order to minimize the possible effects of endolithic organisms.
Below are a few recommended protocols for processing coral samples.
DNA Purification
# Grind/Homogenize tissue samples with mortar and pestle.
# Transfer sample to a ZR Bashing Bead Lysis Tube and proceed with ZymoBIOMICS DNA Kit protocol.
# Fine powder samples may be processed with or without bead beating.
RNA Purification
# Grind/Homogenize tissue samples with mortar and pestle
# Lyse samples using bead beating with a high-speed homogenizer in TRI Reagent ( ZR BashingBead Lysis Tubes (2.0 mm)) with a FastPrep-24 for at least 40 seconds).
# Centrifuge the sample and transfer the supernatant to an RNase-free tube
# Proceed to process the supernatant following the Direct-zol RNA Kit protocol.
The growing threat bleaching poses to the genetic resilience of reef ecosystems makes the analysis of coral DNA and RNA critical for both conservation efforts and predictions of future environmental stressors. With this information, conservation scientists can determine which species are most threatened by climate change, coral bleaching and associated environmental stressors and can find proactive solutions to mitigate this risk.
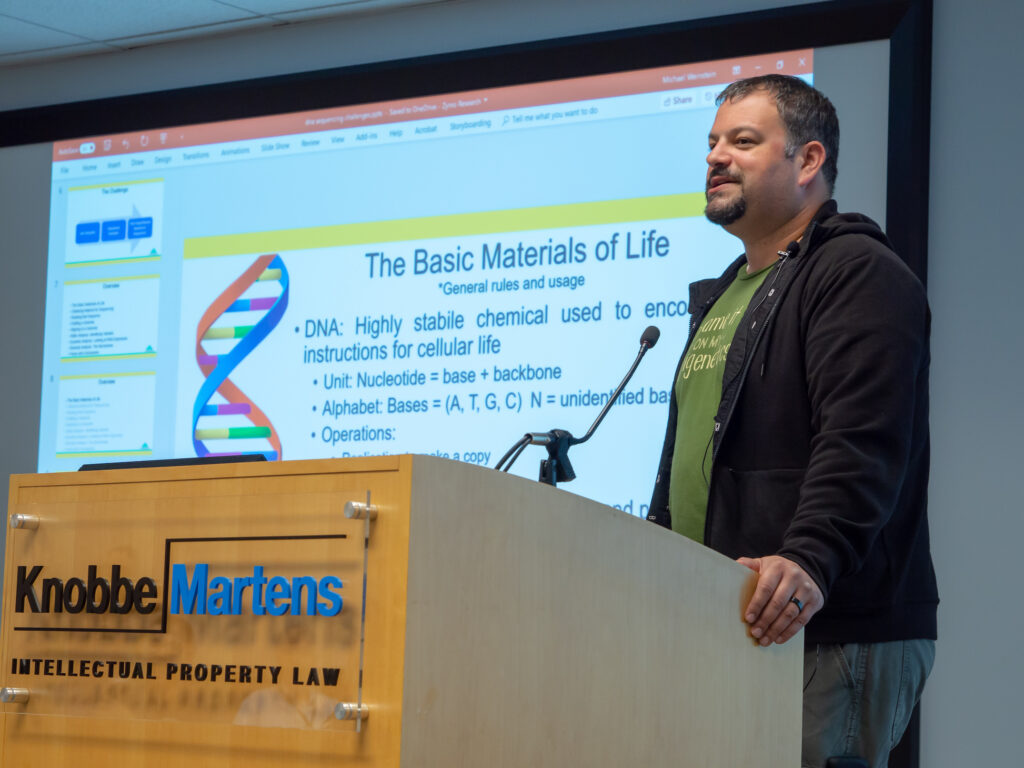
High-throughput DNA sequencing has created a revolution in biology and has caused an exponential growth in the amount of biological data currently being generated. This presents challenges in many fields ranging from biochemistry to computer science to mathematics and statistics. In a comprehensive presentation, Michael Weinstein explains how sequence data is generated, some of the standard methods for storing DNA sequence data, one of the earliest challenges of how to align random short segments of DNA to a template genome, and where this technology is likely going in the future.
Michael Weinstein, Ph.D., gives a presentation to the Orange County Chapter of the Association for Computing Machinery (ACM).
From being used as a gift to the gods of ancient Egypt to sweetening tea and topping biscuits, humans have been consuming honey for thousands of years.1 However, honey can be used for more than just food, as it is teeming with DNA. This genetic information can be used to study everything from honey bee health to the source of the nectar that gives honey its distinctive flavors.
Sweet Insights
The DNA from honey is largely from pollen and can be used to tell what types of flowers the honey is made from and show diversity in a bee’s diet.2 In addition to cellular DNA, honey bees also deposit cell-free DNA into the honey, which can be used to study bee health. Moreover, any microbes deposited into the honey will also be reflected in the overall genetic profile and may give additional insights into bee health.
Colony Collapse Disorder
Recently there has been a devastating decline in the global bee population, with observation of colony collapse and mass loss of worker bees, called Colony Collapse Disorder (CCD). With representatives from government agencies and academia, in 2007 the USDA established a CCD Steering Committee in hopes to understand and take action against CCD. One of the main components of the CCD Action Plan is to survey and collect data to determine the extent of CCD and help counter bee mortality factors.
To study this, researchers are now extracting DNA from honey to track the diet and overall health of honey bees. It is possible that the insight gained from these studies will help researchers better understand the causes of such colony collapse phenomena and help save future bee populations.
A Sticky Situation
Unfortunately, DNA extraction from honey can be very difficult due to its high viscosity and low water content. One workaround is to dilute the honey prior to extraction. With smaller proportional amounts of honey, the lysis buffer of a DNA extraction kit can then enable efficient purification. While processing honey can be very difficult, these steps will ensure a smooth and easy workflow.
For cellular DNA extraction from honey:
Dilute DNA with water in a 1:3 dilution (for instance 100 ml of honey with 300 ml water)
Incubate at 55°C for 30 minutes to homogenize
Separate into smaller volumes and centrifuge at 10,000 x g for 10 minutes in a microcentrifuge, or in a large centrifuge at 3,000 x g for 15 minutes
Using analysis of DNA found in honey to will give us a deeper understanding about bee diet and health. Moreover, expanding our understanding of factors leading to CCD will aid in conservation efforts to protect a key component of our global agriculture industry.
Learn more about the Zymobiomics DNA Kits used in this blog:
1. https://www.nationalgeographic.com.au/history/honey-in-the-pyramids.aspx 2. Di Pasquale G, Salignon M, Le Conte Y, Belzunces LP, Decourtye A, Kretzschmar A, Suchail S, Burnet J, Alaux C. Influece of Pollen Nutrition on Honey Bee Health: Do Pollen Quality and Diversity Matter?. PLoS. ONE. 2013;8:8.
Gel electrophoresis is the tried and true method to analyze and isolate DNA fragments based on size. Following electrophoretic resolution, specific bands can be excised an agarose gel matrix and further processed to purify the DNA. For many workflows, gel electrophoresis is still the best way to separate specific sizes of DNA (especially for fragments larger than 1 kb). Many Next-Gen Sequencing (NGS) library preparations still require resolving the samples using agarose gels to separate out fragments before sequencing. However, recovering DNA from gel excisions can be challenging with many researchers struggling to recover more than 50% yield from the original input. With extra attention to a few critical points, DNA yield and quality can greatly improve.
Steps for Gel Electrophoresis:
Start With the Set
To recover the most DNA possible, considerations need to be made before the gel is even set. It is important to validate the specifications of the kit to determine if it is compatible with the gel. For example, the Zymoclean Gel DNA Recovery Kit is compatible with both TAE & TBE buffered agarose gels.
Additionally, we recommend choosing the combs that produce the smallest wells as possible for the volume of the DNA solution to be resolved. This will ultimately keep the size of the band in a more concentrated space and thus make gel excision slices smaller.
Work Quickly
It is important to mind the time that the gel is exposed to UV light. The longer that the sample is kept on the lamp, the greater the risk of the DNA becoming damaged in this process. Therefore, it is highly recommended to work quickly and efficiently when imaging the gel and excising the band.
Watch Your Percentages
Typically, the agarose gel percentage is determined by the DNA fragment sizes. Smaller fragments require a tighter matrix to separate the bands and obtain clear visualization. This tighter matrix requires a higher percentage of agarose to separate out small DNA fragments. Normally, agarose gels under 2% can be easily processed. However, if a gel is over 2% agarose, an additional volume of Agarose Dissolving Buffer is recommended to ensure the gel is completely dissolved prior to further processing.
Cut The Slice Close to the DNA Band
Optimizing your sample input is crucial for any protocol and recovering DNA from gel excisions is no different. In this case, it is extremely important to ensure that the slice is cut as close to the desired DNA band as possible. Doing this reduces the amount of agarose that needs to solubilize. We recommend weighing the excised gel slice to ensure that it does not exceed 400 mg. If it does exceed this amount, the reaction will need to be scaled up.
Ensure Gel Slice Has Dissolved
It is critical to make sure that the agarose is completely dissolved before binding onto a column. If there are any traces of partially undissolved agarose, it may leech salts into the matrix which will copurify with the DNA. These salts lead to an impure sample with a low 260/230 ratio. Moreover, undissolved agarose will retain DNA as well as clog and lower the efficiency of purification steps. To avoid this, make sure that the gel slice is completely dissolved before adding it to the column.
Watch the Temperature
The dissolving temperature is critical and performs best at 55 °C. However, this temperature should not rise above 60°C as it increases the chances of DNA degradation and sample loss.
Use Caution With the Column
o ensure the best possible recovery, it is important that the eluted DNA is pure and free of salts and other contaminants. To do this, be deliberate about the wash steps of the protocol. It is recommended to run the wash buffer along the edge of the column walls in order to flush out any of the salts that may be leftover from the Agarose Dissolving Buffer. When eluting, be sure to place the elution buffer directly onto the column matrix. This will help to prevent the eluate from collecting any salts that may have dried higher up on
SIZE MATTERS
Large DNA fragments (>11 kb) are tricky to recover as they are more difficult to elute from the column matrix. Standard kits, including the Zymoclean Gel DNA Recovery Kit, can recover up to 10 kb of DNA. For fragments in the upper range of this (8-10 kb), we recommend incubating the elution buffer for up to five minutes at room temperature. Additionally, using a pre-warmed (60-70 °C) elution buffer can help to increase the elution efficiency.
For DNA fragments greater than 10 kb, we recommend using a kit validated on for high molecular weight DNA, such as the Zymoclean Large Fragment DNA Recovery Kit. This kit includes a column designed for easier elution of very large DNA.