Can Coral DNA Measure Ocean Health?

Can Coral DNA Measure Ocean Health?

A Silent Death

In 2016, a silent death wrapped around the Great Barrier Reef off the coast of Australia and drained the color and life from more than half its coral. The event was unprecedented and left researchers around the world with new questions, one more troubling than others. Could these beautiful underwater ecosystems be messengers for something bigger?

Coral Bleaching

Recent effects of climate change have led to a dangerous rise in seawater temperatures which has devastated coral reefs across the globe. Ocean temperatures and pollution can cause stress to the coral which results in the loss of the colorful algae that lives within their tissues in a process called “bleaching.”

Losing the algae results in a loss of the major source of food and energy for the coral and leaves it susceptible to diseases and death. While only occupying 1% of the entire ocean, coral reefs have one of the highest biodiversity in the world and provide habitats for up to 25% of all marine life [1]. Therefore, the impact of environmental changes on coral can be used as a proxy for measuring the health of the ocean.

Genetic Diversity

Genetic diversity and high variability in DNA are critical factors for a species’ capacity for adaption, extinction risk, and resistance to environmental stress. A genomic study performed by the Hawaii Reef Connectivity Consortium found that areas exposed more frequently to bleaching effects have decreasing levels of genetic diversity in coral as well as the many inhabitants of the reefs [2]. Current conservation strategies are focused on protecting the genetic diversity of coral and therefore reducing their extinction risk caused by growing climate change.

Taking this further, some researchers use DNA to RNA ratio studies as a biochemical growth-rate indicator for studies of fish and marine invertebrates (including coral) [3]. The ratio is useful because DNA is a fixed amount per cell whereas RNA can vary depending on metabolic need. Therefore, the RNA/DNA ratio may provide a better understanding of the coral populations’ response to environmental stress caused by climate change because of the strain on protein production.

Delicate Yet Difficult

While the information provided by this RNA/DNA ratio is critical to understanding the risks posed by environmental stress, purifying DNA and RNA from coral sample can be tricky. Coral tissues contain strong collagen fibers, which can make cells lysis difficult. However, high-quality DNA and RNA can still be isolated and purified from coral tissue with special considerations. For example, it is suggested to remove as much skeleton as possible from the coral tissue in order to minimize the possible effects of endolithic organisms.

Below are a few recommended protocols for processing coral samples.

DNA Purification

  • # Grind/Homogenize tissue samples with mortar and pestle.
  • # Transfer sample to a ZR Bashing Bead Lysis Tube and proceed with ZymoBIOMICS DNA Kit protocol.
  • # Fine powder samples may be processed with or without bead beating.

RNA Purification

  • # Grind/Homogenize tissue samples with mortar and pestle
  • # Lyse samples using bead beating with a high-speed homogenizer in TRI Reagent ( ZR BashingBead Lysis Tubes (2.0 mm)) with a FastPrep-24 for at least 40 seconds).
  • Centrifuge the sample and transfer the supernatant to an RNase-free tube
  • # Proceed to process the supernatant following the Direct-zol RNA Kit protocol.
  •  

The growing threat bleaching poses to the genetic resilience of reef ecosystems makes the analysis of coral DNA and RNA critical for both conservation efforts and predictions of future environmental stressors. With this information, conservation scientists can determine which species are most threatened by climate change, coral bleaching and associated environmental stressors and can find proactive solutions to mitigate this risk.

Learn more about the methods used in this blog:

Where Biology Meets Big Data

Where Biology Meets Big Data

High-throughput DNA sequencing has created a revolution in biology and has caused an exponential growth in the amount of biological data currently being generated. This presents challenges in many fields ranging from biochemistry to computer science to mathematics and statistics. In a comprehensive presentation, Michael Weinstein explains how sequence data is generated, some of the standard methods for storing DNA sequence data, one of the earliest challenges of how to align random short segments of DNA to a template genome, and where this technology is likely going in the future.


VIDEO


The DNA Source Everyone is Buzzing About

The DNA Source Everyone is Buzzing About

From being used as a gift to the gods of ancient Egypt to sweetening tea and topping biscuits, humans have been consuming honey for thousands of years.1 However, honey can be used for more than just food, as it is teeming with DNA. This genetic information can be used to study everything from honey bee health to the source of the nectar that gives honey its distinctive flavors.

Sweet Insights

The DNA from honey is largely from pollen and can be used to tell what types of flowers the honey is made from and show diversity in a bee’s diet.2 In addition to cellular DNA, honey bees also deposit cell-free DNA into the honey, which can be used to study bee health. Moreover, any microbes deposited into the honey will also be reflected in the overall genetic profile and may give additional insights into bee health.

Colony Collapse Disorder

Recently there has been a devastating decline in the global bee population, with observation of colony collapse and mass loss of worker bees, called Colony Collapse Disorder (CCD). With representatives from government agencies and academia, in 2007 the USDA established a CCD Steering Committee in hopes to understand and take action against CCD. One of the main components of the CCD Action Plan is to survey and collect data to determine the extent of CCD and help counter bee mortality factors.

To study this, researchers are now extracting DNA from honey to track the diet and overall health of honey bees. It is possible that the insight gained from these studies will help researchers better understand the causes of such colony collapse phenomena and help save future bee populations.

A Sticky Situation

Unfortunately, DNA extraction from honey can be very difficult due to its high viscosity and low water content. One workaround is to dilute the honey prior to extraction. With smaller proportional amounts of honey, the lysis buffer of a DNA extraction kit can then enable efficient purification. While processing honey can be very difficult, these steps will ensure a smooth and easy workflow.

For cellular DNA extraction from honey:

  1. Dilute DNA with water in a 1:3 dilution (for instance 100 ml of honey with 300 ml water)
  2. Incubate at 55°C for 30 minutes to homogenize
  3. Separate into smaller volumes and centrifuge at 10,000 x g for 10 minutes in a microcentrifuge, or in a large centrifuge at 3,000 x g for 15 minutes
  4. Remove supernatant
  5. Resuspend in PBS
  6. Continue with the extraction by using the ZymoBIOMICS DNA Kits

For cell-free DNA extraction from honey:

  • >Dilute DNA with water in a 1:3 dilution (for instance 100 ml of Honey with 300 ml Water)
  • >Incubate at 55°C for 30 minutes to homogenize
  • >Add 70 µl of Urine Conditioning Buffer to every 1 ml of honey solution
  • >Centrifuge at 10,000 x g for 10 minutes in a microcentrifuge, or in a large centrifuge at 3,000 x g for 15 minutes
  • .>Remove supernatant
  • >Resuspend in PBS
  • >Continue with the extraction by using the ZymoBIOMICS DNA Kits

Using analysis of DNA found in honey to will give us a deeper understanding about bee diet and health. Moreover, expanding our understanding of factors leading to CCD will aid in conservation efforts to protect a key component of our global agriculture industry.

Learn more about the Zymobiomics DNA Kits used in this blog:

References:


1. https://www.nationalgeographic.com.au/history/honey-in-the-pyramids.aspx
2. Di Pasquale G, Salignon M, Le Conte Y, Belzunces LP, Decourtye A, Kretzschmar A, Suchail S, Burnet J, Alaux C. Influece of Pollen Nutrition on Honey Bee Health: Do Pollen Quality and Diversity Matter?. PLoS. ONE. 2013;8:8.

How to Recover More DNA from Agarose Gels

How to Recover More DNA from Agarose Gels

What Is Gel Electrophoresis?

Gel electrophoresis is the tried and true method to analyze and isolate DNA fragments based on size. Following electrophoretic resolution, specific bands can be excised an agarose gel matrix and further processed to purify the DNA. For many workflows, gel electrophoresis is still the best way to separate specific sizes of DNA (especially for fragments larger than 1 kb). Many Next-Gen Sequencing (NGS) library preparations still require resolving the samples using agarose gels to separate out fragments before sequencing. However, recovering DNA from gel excisions can be challenging with many researchers struggling to recover more than 50% yield from the original input. With extra attention to a few critical points, DNA yield and quality can greatly improve.

Steps for Gel Electrophoresis:

Start With the Set

To recover the most DNA possible, considerations need to be made before the gel is even set. It is important to validate the specifications of the kit to determine if it is compatible with the gel. For example, the Zymoclean Gel DNA Recovery Kit is compatible with both TAE & TBE buffered agarose gels.

Additionally, we recommend choosing the combs that produce the smallest wells as possible for the volume of the DNA solution to be resolved. This will ultimately keep the size of the band in a more concentrated space and thus make gel excision slices smaller.

Work Quickly

It is important to mind the time that the gel is exposed to UV light. The longer that the sample is kept on the lamp, the greater the risk of the DNA becoming damaged in this process. Therefore, it is highly recommended to work quickly and efficiently when imaging the gel and excising the band.

Watch Your Percentages

Typically, the agarose gel percentage is determined by the DNA fragment sizes. Smaller fragments require a tighter matrix to separate the bands and obtain clear visualization. This tighter matrix requires a higher percentage of agarose to separate out small DNA fragments. Normally, agarose gels under 2% can be easily processed. However, if a gel is over 2% agarose, an additional volume of Agarose Dissolving Buffer is recommended to ensure the gel is completely dissolved prior to further processing.

Cut The Slice Close to the DNA Band

Optimizing your sample input is crucial for any protocol and recovering DNA from gel excisions is no different. In this case, it is extremely important to ensure that the slice is cut as close to the desired DNA band as possible. Doing this reduces the amount of agarose that needs to solubilize. We recommend weighing the excised gel slice to ensure that it does not exceed 400 mg. If it does exceed this amount, the reaction will need to be scaled up.

Ensure Gel Slice Has Dissolved

It is critical to make sure that the agarose is completely dissolved before binding onto a column. If there are any traces of partially undissolved agarose, it may leech salts into the matrix which will copurify with the DNA. These salts lead to an impure sample with a low 260/230 ratio. Moreover, undissolved agarose will retain DNA as well as clog and lower the efficiency of purification steps. To avoid this, make sure that the gel slice is completely dissolved before adding it to the column.

Watch the Temperature

The dissolving temperature is critical and performs best at 55 °C. However, this temperature should not rise above 60°C as it increases the chances of DNA degradation and sample loss.

Use Caution With the Column

o ensure the best possible recovery, it is important that the eluted DNA is pure and free of salts and other contaminants. To do this, be deliberate about the wash steps of the protocol. It is recommended to run the wash buffer along the edge of the column walls in order to flush out any of the salts that may be leftover from the Agarose Dissolving Buffer. When eluting, be sure to place the elution buffer directly onto the column matrix. This will help to prevent the eluate from collecting any salts that may have dried higher up on

SIZE MATTERS

Large DNA fragments (>11 kb) are tricky to recover as they are more difficult to elute from the column matrix. Standard kits, including the Zymoclean Gel DNA Recovery Kit, can recover up to 10 kb of DNA. For fragments in the upper range of this (8-10 kb), we recommend incubating the elution buffer for up to five minutes at room temperature. Additionally, using a pre-warmed (60-70 °C) elution buffer can help to increase the elution efficiency.

For DNA fragments greater than 10 kb, we recommend using a kit validated on for high molecular weight DNA, such as the Zymoclean Large Fragment DNA Recovery Kit. This kit includes a column designed for easier elution of very large DNA.


Feluda Test – A new rapid test method for the identification of SARS-CoV-2

09/25
2020

Feluda Test – A new rapid test method for the identification of SARS-CoV-2

CRISPR-test gets approval in India

Just recently, the TATA Group received approval for the commercial launch of “Feluda” (acronym for FNCas9 Editor Limited Uniform Detection Assay) by the Drugs Controller Gerneral of India.


What is Feluda?

The Feluda test is the first CRISPR/Cas9 (Clustered Regularly Interspaced Short Palindromic Repeats) rapid test available for COVID-19 detection. With this new qPCR independent point-of-care diagnostic approach, the genomic sequence of SARS-CoV-2 can be detected by Milenias lateral flow assay HybriDetect.

The paper strip test was developed at the Council of Scientific and Industrial Research’s constituent lab, the Institute of Genomics and Integrative Biology (CSIR-IGIB) based in New Delhi, India. The testing kit addresses the urgent need for accurate COVID-19 mass testing and has many advantages compared to the gold standard, qPCR. Like SHERLOCK (specific high-sensitivity enzymatic reporter unlocking) which is a COVID 19 test using Cas12 for detection of SARS-CoV-2, developed by scientists from the Broad Institute in the US, the name Feluda refers to an Indian fictive detective (film director: Satyajit Ray).

Advantages of the Feluda test compared to qPCR:

# Affordability
# Can be used in settings with limited resources
# Less time to result (around 45 minutes)
# No qPCR equipment (no need for expensive devices)
# High ease of use
# Lateral Flow based readout for easy interpretation of results

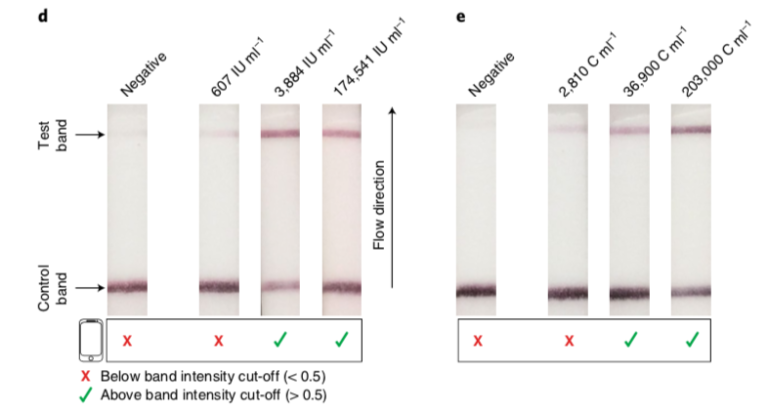
With 96% sensitivity and 98% specificity, Feluda’s analytical performance is comparable to the qPCR results.

How the Feluda test works

The COVID-19 test developed in New Delhi, India by a research team led by Debojyoti Chakraborty and Souvik Maiti is based on a Cas9 enzymatic readout for detecting nucleotide sequences and identifying nucleobase identity. Just a few weeks ago, Emmanuelle Charpentier and Jennifer Doudna have been awarded the 2020 Nobel Prize in Chemistry for their development of CRISPR/Cas9 gene editing technology. The Cas9 readout used for coronavirus detection has requirement of trans-cleavage activity of reporter molecules like Cas12 or Cas13 methods.

The scientists from CSIR-IGIB used Cas9 from Francisella novicida (FNCas9), which shows very high mismatch sensitivity and can distinguish between nucleotide sequences differing by only one mismatch. The principle of the paper strip test was originally designed for the identification of sickle cell anemia, a disease caused by a point mutation, and adapted to COVID-19 testing due to the Coronavirus outbreak resulting in an urgent need for mass testing.

The FnCas9 used in this new method does not produce collateral activity on substrates due to the use of a catalytically inactive FnCas9-gRNA-complex. Therefore, it is an affinity based method and no trans-cleavage signal output is generated.

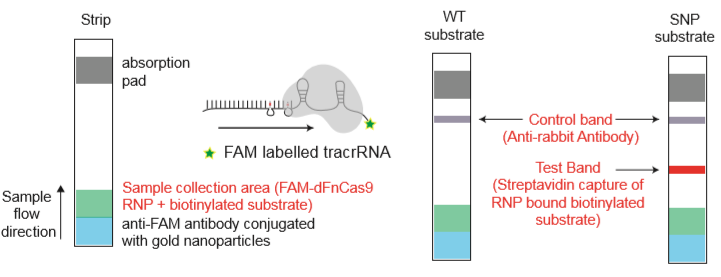
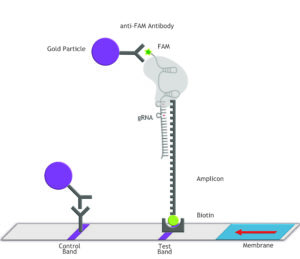
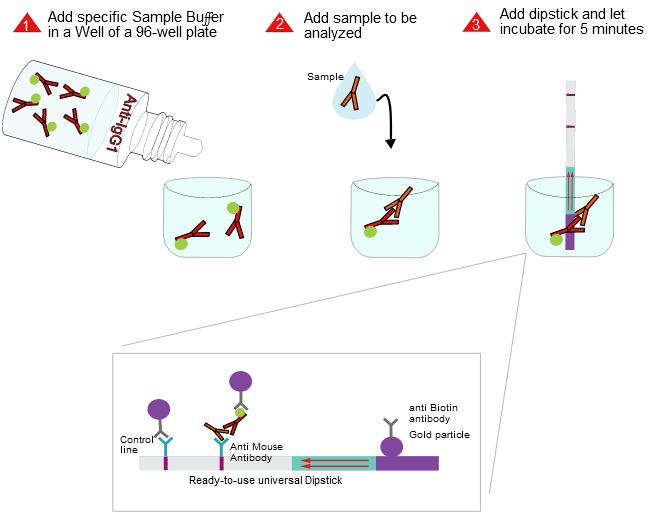
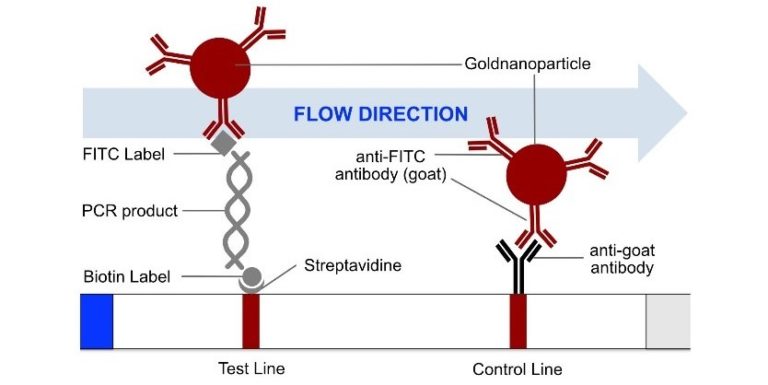
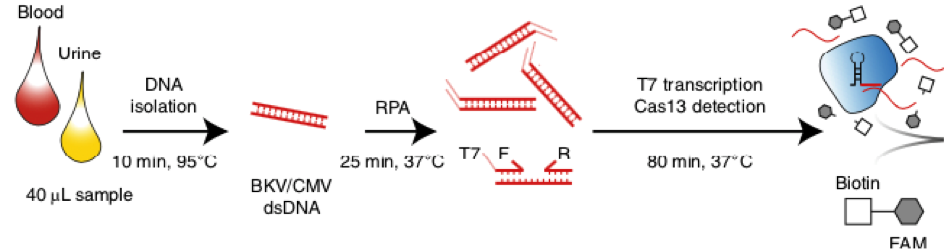
Fig. 1: Feluda test principle on HybriDetect. FnCas9 with FAM labeled gRNA binds to biotinylated sample if result is positive.

The Feluda test and Milenia HybriDetect

The indian researchers designed a gRNA, labeled with FAM, which is important for the visualization of the test line on Milenia HybriDetect (Figure 2).

After RNA extraction, the first step of the paper strip test is an optimized single step Reverse Transctription-PCR (RT-PCR), or alternatively a RPA protocol, where the sample gets amplificated and biotinylated.

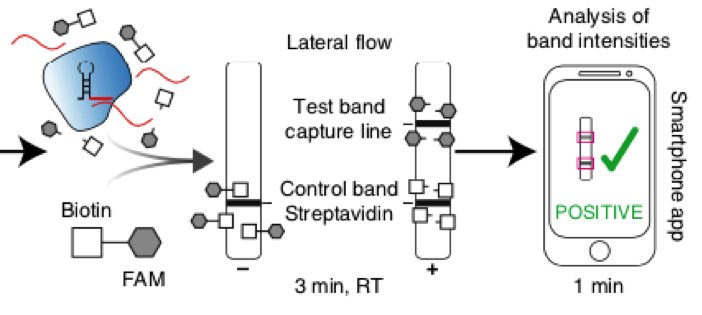
In the next step, the FnCas9 gRNA (labeled with FAM) is incubated with the biotinylated substate (virus sequence if sample is positive). Due to the streptavidin, immobilized on the HybriDetect dipstick, the RNP Complex (CRISPR ribonucleoprotein) binds to the test line (Figure 2).

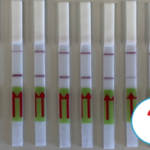
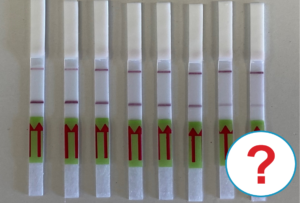
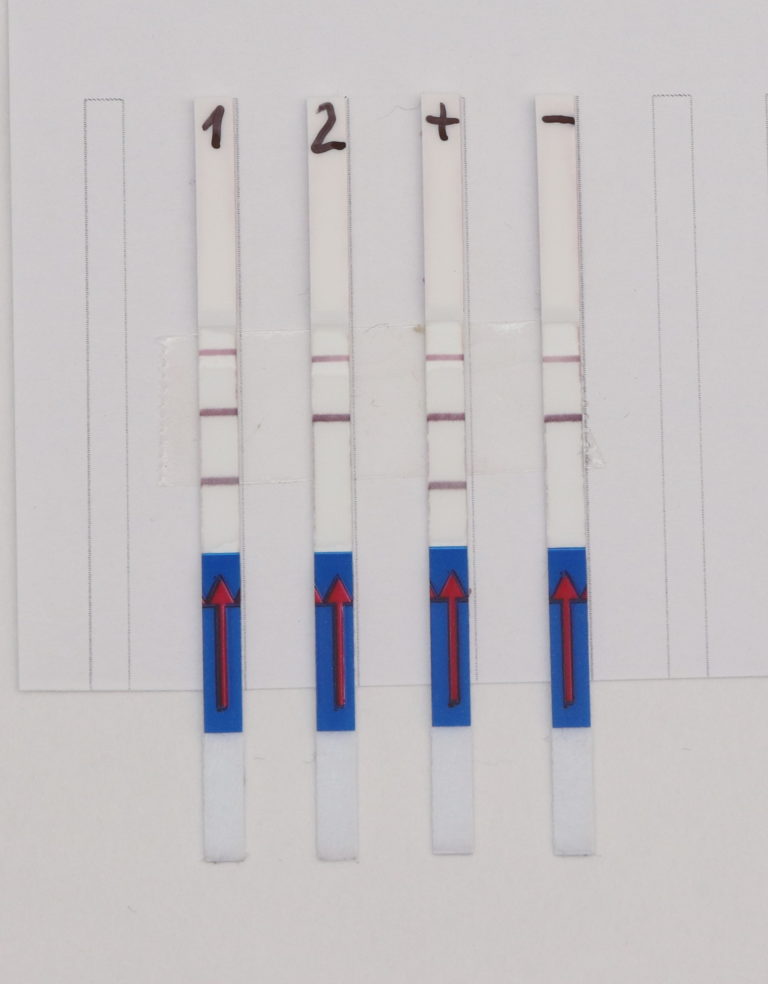
The RNP-complex bound to the labeled substrate is visualized with anti-Fam antibodies conjugated to gold nanoparticles and a positive test line is formed if substrate is bound to the RNP-complex. Summarized this means, two lines for a positive and a single line for a negative test result. The visual interpretation of the HybriDetect dipstick is as easy as the interpretation of a pregnancy test and therefore no trained personnel is required.

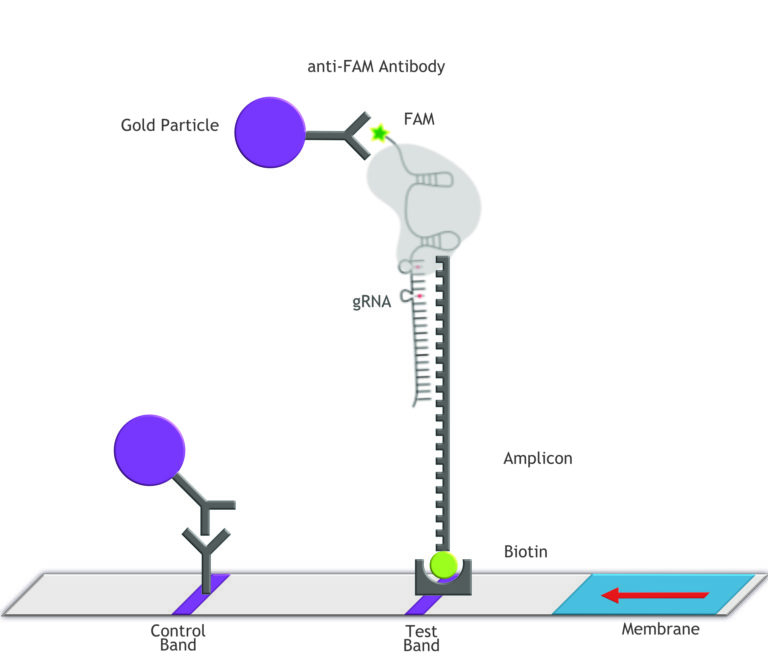
Fig.2: Milenia HybriDetect and FnCas9. The test is positive if the biotinylated DNA is present and binds to streptavidin on the T-Line. FnCas9 binds to the biotinylated DNA and is captured by FAM antibodies coated with gold nanoparticles for visualization.

When to expect Feluda Test to be available?

The Union Health Minister of India Harsh Vardhan said on October 11th, that the rollout of the new Covid-19 test is expected in the next few weeks. The test developed by scientists from the Council of Scientific and Industrial Research’s Institute of Genomics and Integrative Biology in New Delhi is going to provide results in 45 minutes and is priced around Rs 500 ( ~ 5,70 Euro).
Additional Information on the Feluda test

# Compared to other CRISPR methods for COVID Detection, including SHERLOCK and DETECTR, Feluda does not need a reporter and is therefore less complex.
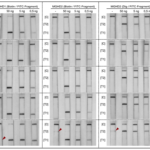
The LOD of indias new test method is 10 copies of purified viral sequence as the authors mention in their latest publication (https://www.medrxiv.org/content/10.1101/2020.09.13.20193581v1.full.pdf)
To assist the detection of COVID-19 the scientists developed a smartphone app named TOPSE (True Outcome Predicted via Strip Evaluation) which gives a predictive score based on background correction. Due to the stoichiometric binding affinity of FnCas9 RNP to the target, a semi-quantitative readout of Feluda is possible with TOPSE.

Feluda for at home testing

The Scientists from CSIR-IGIB are currently working on a Feluda version for at home coronavirus testing. Therefore they are trying to do a machine free, RPA based amplification of the virus genome. The aim is an end-to end instrumentation free testing protocol.

Author
Dr. Jacqueline Hoffmann
QA — RA
jhoffmann@milenia-biotec.de
+49 (641) 948883 – 0

Related Products

Related Articles

Diagnostic CRISPR Tools and Techniques
Lateral Flow Assays using Genome Editing Tools

A customers question: What is the limit of detection of Milenia HybriDetect?
Milenia HybriDetect is a tool for our customers and us to develop lateral flow based point of care tests.

HybriDetect and Temperature Effects
Using higher Temperatures: Part of the NAFLIA Toolbox

Lateral Flow Test Development for COVID-19 based on Nucleic Acid Detection
Amplicon detection via the lateral flow test Milenia “HybriDetect”

How to overcome contamination in DNA amplification based Lateral Flow Assays

09/25
2020

How to overcome contamination in DNA amplification based Lateral Flow Assays

Contamination can happen, no matter what type of amplification method used: LAMP, RPA or PCR

Milenias HybriDetect is a ready-to-use, universal dipstick based on the lateral flow technology for the detection of various molecules. It is mainly used for the detection of amplicons, generated by LAMP, RPA or PCR by our customers.

As in standard PCR experiments, which are analyzed by gel electrophoresis or qPCR experiments, cross-contamination is a problem our customers are faced with. Therefore we want to give some information and advice to help you avoid contaminations in RPA, LAMP or PCR assays combined with our Lateral Flow tests HybriDetect and HybriDetect 2T

Contamination in amplification steps can occur from many reasons

The general reason for contamination is the presence of templates and amplicons in the lab environment. Most labs are working with several employees on one topic for some months or years, for example an inherited disease, where a specific gene plays a major role. You can imagine, contamination of the lab environment with this specific gene can easily occur (I had this problem with GFP, which everyone used as reporter gene during my phD).

Finding the source of a contamination is like looking for a needle in a haystack. To name a few possibilities: check/clean/exchange your pipettes, the centrifuge, the bench top, vortex, racks, tips, reagents (polymerase, buffer, nucleotides, water,…).

General Lab Practice to avoid Contamination

Most people (as so do I) working with DNA amplification methods know the terrible moment, seeing a positive signal in your negative control. First, you still have a faint hope: “Maybe I was not concentrated and put some template DNA instead of Water into my negative control”

After repeating the experiment and seeing again false positive results, one has to do a lot of troubleshooting.

To help you, prevent this time wasting, annoying work I want to give some general advices:

  1. My first recommendation is to spatially separate the two main steps of your experiment: a) Preparation of the PCR/LAMP/RPA reaction and b) the amplification step and lateral flow readout. The mastermix should additionally be prepared in a template-free area of your lab. If you have enough space, go to another room to do the different steps. When changing the room, don’t forget to change your gloves and lab coat. Even if it is time consuming and annoying, think of the time you might lose, if you have a cross-contamination! Don’t go back to the preparation area with your samples if you already have been in the amplification area, you always have to work in one direction.
  2. I know, most people working in the lab have special preferences when it comes to pipettes, sometimes it’s like a superstition. But I will recommend you not to use the same pipette for the different steps of your Experiments. You need at least one or more (depending on the volumes) pipette(s):
    * for the preparation of your mastermix
    * for the addition of the template DNA
    * for the transfer to the LFA

To further avoid contamination through pipetting: use filter tips.

  1. Same thing for reagents: use dedicated reagents (e.g. water) for the different steps/areas
  2. Try to prevent aerosols as much as you can: Spin all tubes before opening!
  3. Don’t forget to change your gloves between the different steps.
  4. If you have the chance, use a uv sterilizer for the area where your mastermix is prepared
  5. Use a clean (autoclaved) rack
  6. Use nuclease free water, which is purified, double-distilled, deionized and outoclaved.

What to do, if you already have contamination in your amplification experiments?

First of all, change all reagents. If possible, go to another lab with your fresh reagents and check if there is still contamination. Don’t bring anything except the reagents! Do not bring your pipettes!

If there is still contamination, check your reaction. It might be that your primers are non-specifically binding: Design a new set of primers.

Check, if you are doing the 8 steps I mentioned above. You can try to change your pipettes, use filter tips and so on.

Another possibility is to use UNG (uracil-N-glycosylase). You have to use dUTP instead of dTTP in your amplification reaction. Carryover contamination from amplification products can then be prevented by adding UNG to your reaction and incubate it (prior to amplification) for 2 minutes at 50°C. UNG degrades products that have already been through the amplification process by removing Uracil. The polymerase and the other reagents are not affected by the UNG treatment, only carryover products will be removed.

Fig. 1: Contamination in Lateral Flow Assay. Negative sample shows false positive result due to contamination. Comparison of results withour UDG (upper picture) and with UDG (lower picture)


Author
Dr. Ralf Dostatni
Managing Director of Milenia Biotec GmbH
rdostatni@milenia-biotec.de
+49 (641) 948883 – 0

Related Products

Related Articles

Diagnostic CRISPR Tools and Techniques
Lateral Flow Assays using Genome Editing Tools

HybriDetect and Temperature Effects
Using higher Temperatures: Part of the NAFLIA Toolbox

Lateral Flow Test Development for COVID-19 based on Nucleic Acid Detection
Amplicon detection via the lateral flow test Milenia “HybriDetect”

A customers question: What is the limit of detection of Milenia HybriDetect?

08/31
2020

A customers question: What is the limit of detection of Milenia HybriDetect?

Milenia HybriDetect is a tool for our customers and us to develop lateral flow based point of care tests.

Test Principle

The principle works as such that biotin and FITC and – if applicable – digoxigenin and FITC labeled compounds are introduced into the test mixture. These compounds form complexes, which are finally detected by the universal lateral flow strips, Milenia HybriDetect.

Since the market introduction in the year 2003 a high number of immunoassays and molecular biology method based tests have been developed by researchers. At the time of writing this article in July 2020 we could find 129 scientific papers citing the use of Milenia HybriDetect.

Question: What is the limit of detection of Milenia HybriDetect in pmol?

Over the many years of being in the market with our development tool, we got quite a lot of questions from our customers. Some of these questions are frequently raised. The answers to these questions are given on the HybriDetect Landingpage.

Other questions may be raised individually, but we try to respond to every individual question with the best of our knowledge. If we do not know the answer right now, we run experiments in order to supply our customers with an adequate answer. Just recently a customer wanted to know what the limit of detection of Milenia HybriDetect in pmol is!

Customer reports on the sensitivity of Milenia HybriDetect

To answer this question we did a little literature search and assorted several papers dealing with information about the limit of detection of our HybriDetect.

Piepenburg et al. (2006)

In the very first publication on RPA amplification Piepenburg et al. (2006) used Milenia HybriDetect to detect amplicons. They introduced samples with 10 copies each of MRSAIII, MRSAII and MRSAI and 10.000 copies of MSSA (negative control) as a template in their MRSA assay. The test line was clearly visible on all HybriDetect lateral flow strips with MRSA samples, indicating that the sensitivity of the system must be between 1 and 10 copies of the target gene.

Kiatpathomchai et al.. 2018

In 2008 a paper on “Shrimp Taura syndrome virus detection by reverse transcription loop-mediated isothermal amplification combined with a lateral flow dipstick” was published in the Journal of Virological Methods by

Kiatpathomchai et al..

They found out that the combination of their LAMP method and Milenia HybriDetect is overall 100 times more sensitive than an agarose gel and 10 times more sensitive than a nested PCR followed by electrophoresis. Positive side effects of the use of a lateral flow strip were the elimination of a potentially hazardous compound like ethidium bromide, the spimplicity in use and the choice of a true point-of-need application.

Pecchia and Da Lio (2018)

In 2018 Pecchia and Da Lio published a paper with the title “Development of a rapid PCR-Nucleic Acid Lateral Flow Immunoassay (PCR-NALFIA) based on rDNA IGS sequence analysis for the detection of Macrophomina phaseolina in soil”.

The authors found out that the limit of detection of the NALFIA assay was 17.3 fg using 10 μl PCR reaction. In contrast to this the sensitivity of the agarose gel electrophoresis was 17.3 pg using 25 μl of PCR reaction. This means that in the system of Pecchia and Da Lio the sensitivity of Milenia HybriDetect was 1.000 fold higher than the agarose gel.

However, it needs to be stressed that the advantage of Milenia HybriDetect compared to an agarose gel in terms of sensitivity depends on the size of the amplicons to be detected. Pecchia and Da Lio created amplicons of 100 bp length!
The Limit of Detection of HybriDetect can be as low as 0,1 fmol

Beside the literature search, we did experiments to find out the limit of detection of HybriDetect in our lab. Therefore a dual labeled dsDNA (Biotin/FITC), generated by a PCR was transferred to Milenia HybriDetect strips and run. The concentration of the samples ranged from 0 to 250 fmol. The results of the experiment are shown in Figure 1.

Figure 1.Limit of Detection (lower limit) of HybriDetect (MGHD1) and HybriDetect2T (MGHD2).[T1] test line of the MGHD1 and MGHD2. [T2] test line 2 is a special feature of the MGHD2. Analysis was performed with a dual labeled PCR-product (Biotin and FITC: T1, Digoxygenin and FITC: T2).

By using dual labeled dsDNA the LOD was calculated below 1 fmol. This approach is limited in terms of precision due to the purification of the PCR fragments, the measurement procedure and the high dilution of the samples.

Therefore, a different approach was done and a synthetic reporter gene (dual labeld ssDNA, very short oligos) was tested with HybriDetect. The results indicate that 0,5 fmol of the reporter resulted in clear signals on the T-line of the Milenia HybriDetect test strip. Very slight signals were visible by using the reporter below 0,05 fmol. (Figure 2).

Figure 2. Lower detection limit of HybriDetect (MGHD1). [T] test line of the MGHD1. Analysis was performed with a dual labeled Reporter (Biotin and FITC: T).

Conclusion

Milenia HybriDetect is a lateral flow test development platform based on a universal test strip. The product is frequently used in molecular biology applications and customers are interested to know how sensitive their assays can be! As a result of a literature search and own experiments it was demonstrated that Milenia HybriDetect could be up to 1.000 times more sensitive than the detection of amplicons via an agarose gel. The sensitivity of HybriDetect could go down as much as 0,05 fmol.


Literature:

  1. Piepenburg O., Williams C.H., Stemple D.L., Armes N.A. DNA detection using recombination proteins. PLoS Biol 2006; 4(7): e204. DOI:10.1371/journal.pbio.0040204
  2. Kiatpathomchai W., Jaroenram W., Arunrut N., Jitrapakdee S., Flegel TW. Shrimp Taura syndrome virus detection by reverse transcription loop-mediated isothermal amplification combined with a lateral flow dipstick. Journal of Virological Methods 2008; 153: 214–217
  3. Pecchia S. and Da Lio D., Development of a rapid PCR-Nucleic Acid Lateral Flow Immunoassay (PCR-NALFIA) based on rDNA IGS sequence analysis for the detection of Macrophomina phaseolina in soil. Journal of Microbiological Mehtods (2018, Vol 151)


Author
Dr. Ralf Dostatni
Managing Director of Milenia Biotec GmbH
rdostatni@milenia-biotec.de
+49 (641) 948883 – 0

Related Products

Related Articles

Diagnostic CRISPR Tools and Techniques
Lateral Flow Assays using Genome Editing Tools

6 new Articles, referring to the use of CRISPR/Cas and HybriDetect
DNA and RNA Detection with the Help of HybriDetect

HybriDetect and Temperature Effects
Using higher Temperatures: Part of the NAFLIA Toolbox

Lateral Flow Test Development for COVID-19 based on Nucleic Acid Detection
Amplicon detection via the lateral flow test Milenia “HybriDetect”

A Tool for Mouse Antibody Isotype, Subtype and light Chain Detection

08/21
2020

A Tool for Mouse Antibody Isotype, Subtype and light Chain Detection

The Milenia Quick Line Mouse Isotyping Kit is designed for fast and easy identification of mouse antibody isotypes, subtypes and light chains and offers numerous applications

Hybridoma Technology
Specific mouse monoclonal antibodies can be produced by the Hybridoma Technology. This method results in immortal hybrid cells formed by B-lymphocytes and myeloma cells. After the main steps (immunization of the host animal, B-cell and myeloma cell fusion) the experimenter needs to know which subclass is produced by the cells in order to select an antibody clone with the desired features.

Mouse Antibody Structure
The Antibody Structure of Vertebrates is formed by four polypeptide-chains: two light and two heavy chains.

There are two variants of light chains: kappa and lambda. Regarding the light chains one variable and one constant domain exist.In contrast the heavy chains have one variable and three to four constant parts. These constant parts determine the isotype classification. As most other vertebrates, mice have five antibody-isotypes (IgG, IgM, IgA, IgD, IgE) The main antibody subclasses are formed at different stages of the immune response and have different responsibilities. The IgG isotype is once more divided into IgG1, IgG2a, IgG2b, IgG2c and IgG3 (subtypes) because of sequence varieties between the constant regions (depending on mouse strain).

Mouse Antibody Isotyping Kit – Application

The Mouse-Isotyping Kit is a lateral flow immunoassay designed for the determination of mouse monoclonal antibody isotypes, subtypes and light chains within 5 minutes. The immunoassay can be used for cell culture supernatants and/or purified antibodies.

The Mouse Isotyping Kit consists of a Universal Module (the lateral flow strips) and nine specific buffers, which you can choose according to your needs.

Beside the pure identification of antibody isotypes and subtypes, the Milenia Quick Line Mouse Isotyping Kit has many more options for possible applications and Advantages:

Variableapplication: You can chose which isotypes you need to test – the dipstick is universal, the buffers for the different isotypes, subtypes and light chains can be ordered separately.
Fast IgM selection: IgM antibodies can be quickly detected and selected in an early stage of hybridoma production, as IgMs are in most cases undesired when producing monoclonal antibodies.
Fast, easy and low priced application to find out which cell clone produces antibodies, only one drop of cell culture supernatant is needed.
Recloning advantage: if there is only few/expensive antigen available, you can search for positive clones as an easy preselection with this test system.
Purification method: the optimal purification method can be chosen for the specific isotype which results in the highest yield of the antibody.
Purification control: When purifying the cell culture supernatant, you can quickly detect the desired antibody in the individual fractions.
Semi-quantitative detection: If you apply a standard curve with a known amount of antibody, you can check the concentration of antibody in your sample within minutes.
Purity check: You can see if your antibody is clean or if you have any impurities (other subclasses, e.g.: when your antibody is not monoclonal).
Field of application: The assay can be used for cell culture supernatants and/or purified antibodies.
Selection of secondary antibody: Knowing the isotype of the primary antibody can help detecting the right secondary antibody in immunoassay applications.
IgG2c and IgG2a detection: we offer the possibility to discriminate between IgG2a and IgG2c isotypes, which can be important for the selection of the optimal secondary antibody. In other test systems, IgG2c antibodies are often false identified as IgG2a.

Test principle of the Mouse Isotyping Kit

First the isotype-specific Sample buffer (e.g. anti-mouse IgG1) is pipetted into a well of a 96-well microtiter plate. Subsequently the test sample of unknown antibody-subclass is added. If a complex is formed between the Sample buffer and the test sample, binding to an anti-mouse antibody on the universal mouse test strip will result in the formation of a red line.

Antibody Isotype detection in three simple steps. First, the specific antibody Buffer is added in a well. Second, the sample to be analysed is added to the Buffer. Third, the universal dipstick is added. The readout can be performed after 5 minutes of incubation.


This video shows the test procedure of the Milenia Mouse-Isotyping Kit.


Author
Dr. Jacqueline Hoffmann
QA — RA
jhoffmann@milenia-biotec.de
+49 (641) 948883 – 0

Improving the sensitivity of the HybriDetect 2T

05/15
2020

Improving the sensitivity of the HybriDetect 2T

How to use block oligos for better results

Detecting various PCR amplificates with HybriDetect 2T

The amplification of nucleic acids has become an important tool for various areas such as medical diagnostics, food safety and research over the past decades. A quick and easy way to get a visible result of the amplification is to evaluate the amplification product using the HybriDetect 2T strip, a lateral flow evaluation strip.

The most common method for nucleic acid amplification is the polymerase chain reaction (PCR). The operating principle of the HybriDetect 2T strip is described in figure 1.


Fig. 1: HybriDetect 2T principle with PCR sample. labeled PCR amplificate can bind to the test line on the strip using biotin label. Bound sample gets visible through gold nanoparticles, which bind the amplificate via FITC

More sensitivity with higher Volume?

Although PCR amplificates are already good to evaluate with the LF strip, there still is potential for an even more sensitive detection. Currently, the optimal application volume for the LF evaluation is only 2 μl out of the total of 25 μl PCR product. If a larger volume is applied, the intensity of the signal does not increase, as one would presume, but decrease (see fig. 2). This means that only a small fraction of the amplified fragment is actually used for detection. Therefore the evaluation could be much more sensitive, if it would be possible to use the entire amount of PCR product.

Fig.2: Applying larger Volume leads to a loss of sensitivity. Signal intensity of HybriDetect 2T with 2 µl, 10 µl and 25 µl of PCR product.

Free primers causing loss of sensitivity

The loss of sensitivity mentioned above can be explained as follows: To receive as much amplificate of the original DNA sequence as possible, the marked primers are added in excess to the PCR mix. Hence, some free primers, which are not used in the reaction, remain in the PCR product. Due to their markings, these free primers are able to bind to the binding sites of the lateral flow strip (and the binding site of the chromophoric gold conjugate) in competition to the double stranded PCR amplificate as shown in figure 3. Regarding the FITC marked primer, this means that the primer is able to bind onto the anti-FITC antibodies loaded with gold particles in the same way as the PCR product that is to be detected, so that the resulting signal of the PCR product is attenuated.

Fig.3: Loss of sensitivity due to competetive reaction. Comparison of the signal intensities of the ideal case evaluation and the real evaluation, containing the competetive reaction between free FITC labeled primers and PCR product.

Designing block oligos to overcome the loss of sensitivity

An idea to compensate the attenuation of the signal and thus loss of sensitivity caused by the free primers, is reflected in the design of extended and modified antisense sequences of these primers, so-called block oligos. The block oligos consist of the antisense sequence of the corresponding, a few spacer nucleotides, a hairpin structure and additional nucleotides serving as overhang (see fig. 4).

Fig.4: Structure of block oligos to overcome loss of sensitivity. Antisense sequence (blue) bind to free detection primer. Spacer (orange), hairpin (red) and overhang (green) ensure that FITC label (pink) of the detection primer (gray) is shielded.

The idea behind this design is that when these block oligos are added to the PCR mix, after the PCR but prior to the evaluation, they bind to the remaining free primers because of the antisense sequence and the remaining structural elements of the block oligo mask the FITC label of the free primers so that the free primers bound to the block oligos can no longer be bound to the gold conjugate.tag verwenden


Effect of the designed block oligos

To test the effect of the designed block oligos, a test system was developed in which the signal intensity of the block oligo sample was compared with the maximum possible signal intensity (artificial sample without free FITC labeled primers) and with the currently achievable signal intensity. By adding the block oligos to the PCR product and evaluating 25 μl instead of only 2 μl amplificate, a tripling of the signal intensity and thus a tripling of the sensitivity could be reached, as shown in figure 5.

Fig 5.: Effect of the block oligos. Relative signal intensity of the various evaluation variants.

Summary

Regarding the evaluation of PCR amplicons, it was found that the free detection primers, the FITC labeled primers in particular, are responsible for a loss of sensitivity in the evaluation. These free primers can bind to the gold conjugate of the evaluation strips in competition to the PCR amplificate. An improvement for this problem could be achieved with the help of so-called block-oligos, which are added to the PCR product together with the running buffer and whose structure allows them to bind to the free primers and shield their FITC labeling.

Author
Dr. Jacqueline Hoffmann
QA — RA
jhoffmann@milenia-biotec.de
+49 (641) 948883 – 0

Related Products

Related Articles

Diagnostic CRISPR Tools and Techniques
Lateral Flow Assays using Genome Editing Tools

HybriDetect and Temperature Effects
Using higher Temperatures: Part of the NAFLIA Toolbox

Lateral Flow based post-transplantation Monitoring

05/07
2020

Lateral Flow based post-transplantation Monitoring

CRISPR-based diagnosis of infection and rejection with the HybriDetect

HybriDetect helps diagnose viral infections and post-transplantation Monitoring with SHERLOCK

Kaminski et al. developed a fast and easy test to detect causes of graft loss in blood and urine samples from post-transplant patients after kidney transplantation.

The need for a new method to detect organ rejections is highly given, because current invasive methods can take several days and are connected with high costs. The loss of time can lead to an increased risk for patients after transplantation.

The assay is based on the SHERLOCK method, combined with Milenias Lateral Flow Assay HybriDetect, which gained lots of interest in the last weeks due to its ability for Covid-19 detection (read more). SHERLOCK is a CRISPR based method, if you want to get an insight on CRISPR and how it works you can read this article for more information.

Detection of three different parameters

The new diagnostic test for post-transplantation Monitoring is able to detect two common opportunistic viruses, which can lead to graft rejections. In addition, the expression status of a special mRNA that serves as a biomarker for rejection can be examined.

Cytomegalovirus (CMV): CMV-infections are usually not assiciated with symptoms in healthy individuals, but can cause serious illness (even fatal) in patients after organ transplantation.
BK polyomavirus (BKV): After kidney transplantation, the BKV can cause a gradual deterioration in graft function and ultimately even graft loss.
CXCL9 mRNA: The expression of CXCL9 increases during rejection in renal-transplant recipients, therefore CXCL9 mRNA is a useful biomarker to identify refection episodes in kidney transplant patients.

Point of Care -Diagnosis with the help of SHERLOCK

Principally, the CRISPR-based method SHERLOCK is capable to detect almost every viral infection. For the assay, described by Kaminski et al. DNA from uninfected and infected patients was isolated from blood and urine. Conserved regions of CMV and BKV were amplified by Recombinase Polymerase Amplification (RPA). A guide RNA for Cas13 complementary for the RPA product was generated. The nuclease activity of the CRISPR/Cas-complex is activated in presence of the transcribed amplificate. Nuclease-dependent reporter degradation is detectable with the HybriDetect test strips.

31 urine and 36 plasma samples from patients were tested for BKV and CMV. BKV could be detected with 100% sensitivity and specificity. CMV was also detected with high sensitivity and specificity in plasma.

For CXCL9 mRNA detection, RNA was isolated from pelleted urine cells. A preamplification is necessary for a sensitive analysis. Therefore, a one-step RT-PCR was performed. After T7-transcription, Cas13-associated RNA recognition initiated collateral nuclease activity of the CRISPR/Cas-complex. Degradation of a dual labeled reporter leads to increasing test line intensity in the LFA. The Cas13-associated detection method was able to detect CXCL9 mRNA at attomolar level. The detection of kidney rejection was shown with a sensitivity of 93%.

Fig. 1: Post-transplantation monitoring of CMV and BKV with SHERLOCK from human urine and blood samples

Detection of SHERLOCK results by HybriDetect

The authors used Milenias HybriDetect for a fast and easy, but still cost effective readout of their results. With HybriDetect it was possible to see a positive or negative test result within two hours from isolation to detection. Some background noise leaded to a faint test band, and therefore the readout of the assay was difficult at very low levels of target concentration. To work around this background noise, Kaminski et al. developed a smartphone-based software application. This app is able to quantify the band intensities of HybriDetect and gives a valid test result in 1 minute (Fig. 2).

Fig. 2: Detection of SHERLOCK results by Lateral Flow readout

Ultrasensitive detection using SHERLOCK and HybriDetect

CMV and BKV (Fig. 3) were detected at different concentrations in patient samples.BKV infection in a kidney-transplant recipients could be successfully identified with the CRISPR-LFA. After the patient was treated, BKV was not detectable.

The authors also tested the lateral flow signal variability over time. The same ten BKV-positive or negative patient samples were tested on three different days. There was no variety in the results over time.

Kaminski et al. compared different incubation times and temperatures for the lateral flow assay and showed that reaction time and temperature are important variables if quantitative lateral flow readout is done. For more information on this topic see our Blog Article: Lateral Flow Readout for CRISPR/Cas-based detection strategies.

Fig. 3: Detection of CMV and BKV in patient plasma samples with HybriDetect and a smartphone app

Beside the detection of viral DNA, HybriDetect was also able to detect CXCL9 synthetic RNA down to the attomolar range. The detection method was confirmed by testing samples from two patients. In one patient, CXCL9 mRNA was detected during rejection, after treatment the test was negative. The other patient also showed a reduced CXCL9 mRNA level after treatment, but an increased amount 7 month later. Repeated Biopsy showed a chronic active cellular rejection.

Overall this work showed a great advantage when it comes to POC testing for post-transplantation Monitoring. The main advantages are the fast and cost effective tests to enable early diagnosis and monitoring after organ transplantation.

Read the original article here

Reference:

Kaminski et al., 2020. A CRISPR-based assay for the detection of opportunistic infections post-transplantation and for the monitoring of transplant rejection.

More information:

https://www.mdc-berlin.de/news/press/diagnostics-meet-crispr

https://static-content.springer.com/esm/art%3A10.1038%2Fs41551-020-0546-5/MediaObjects/41551_2020_546_MOESM3_ESM.mov

Author
Dr. Jacqueline Hoffmann
QA — RA
jhoffmann@milenia-biotec.de
+49 (641) 948883 – 0