
Intro Solisbiodyne

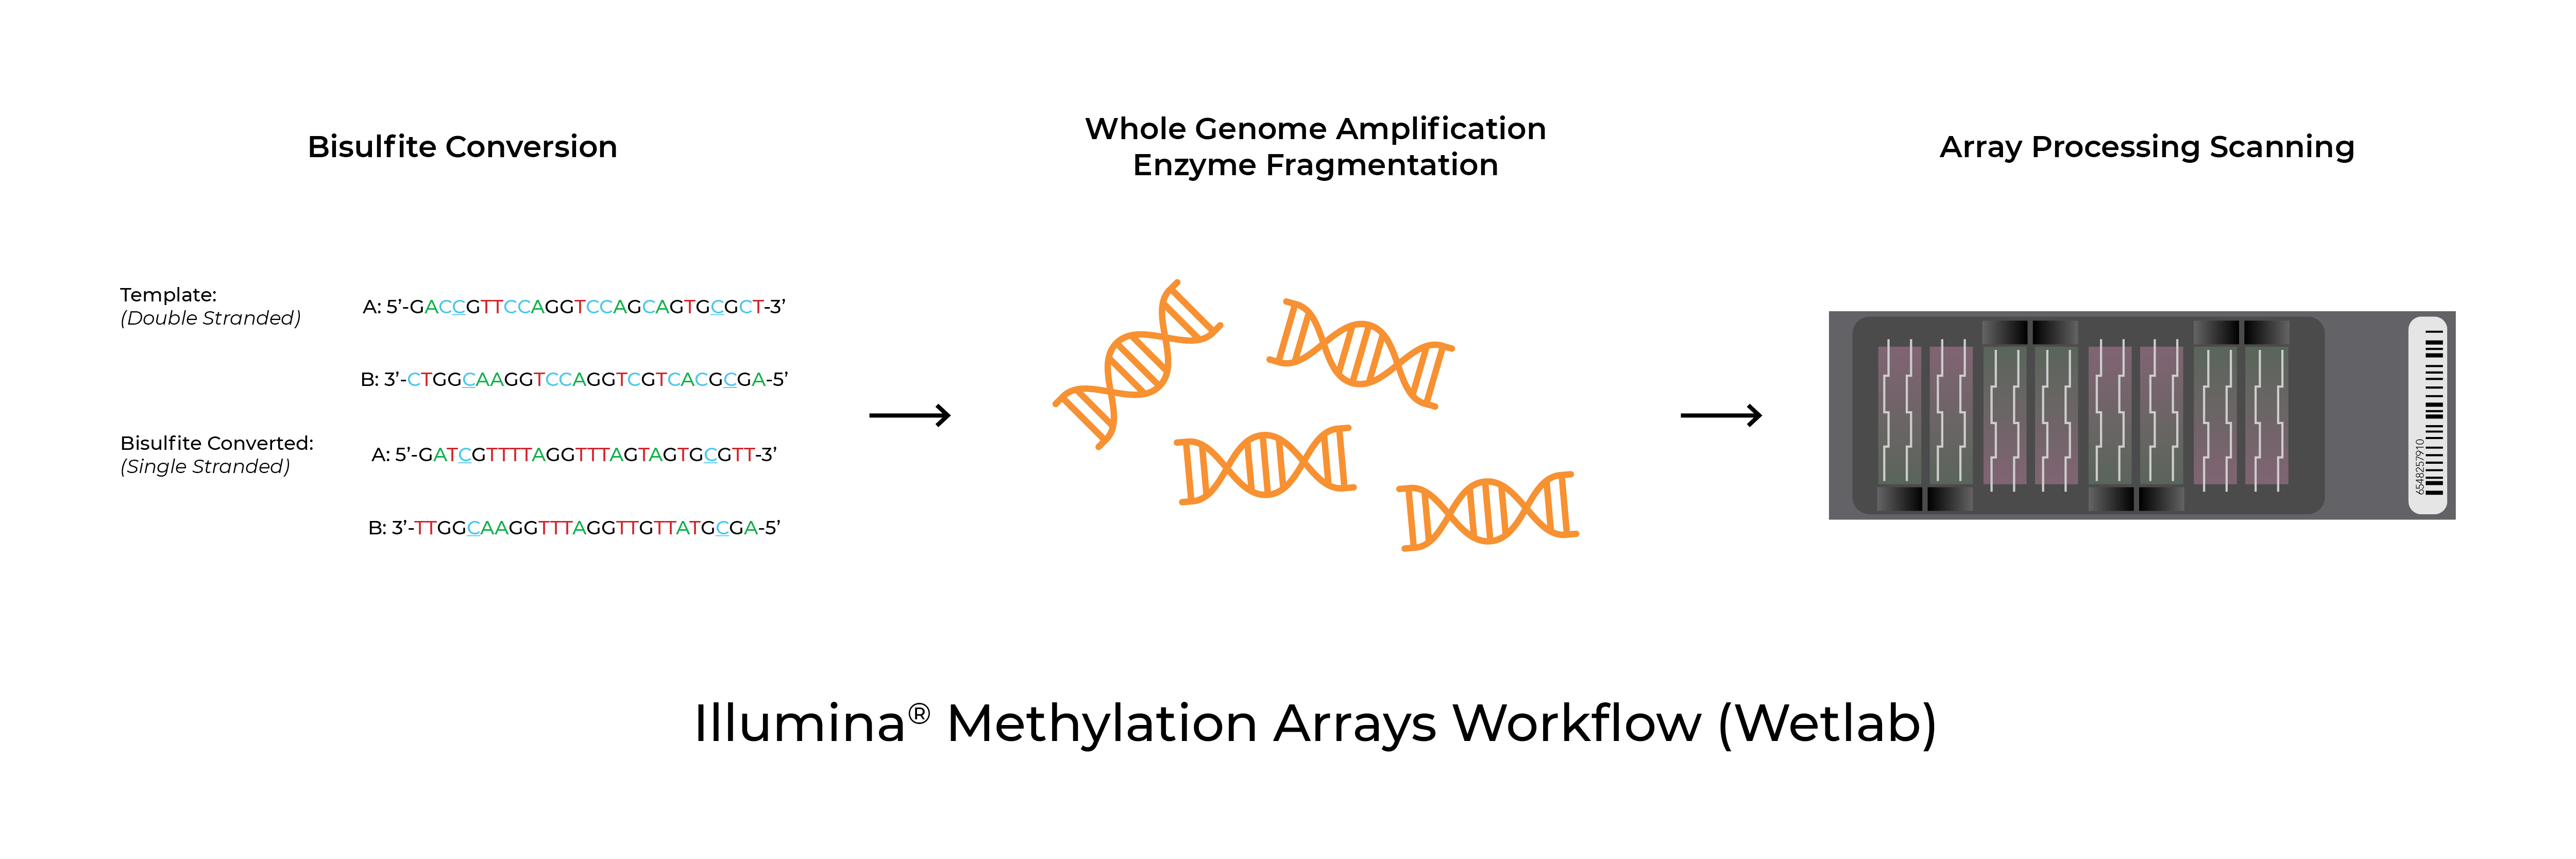
Bisulfite Conversion for Illumina Methylation Arrays
Methylation arrays are common platforms for analyzing 5-methylcytosine. The Infinium™ MethylationEPIC BeadChip and Infinium™ HumanMethylation450 BeadChip (commonly referred to as the EPIC and 450K arrays respectively) as well as the recently launched Infinium™ Mouse Methylation BeadChip from Illumina® all utilize Zymo Research’s bisulfite conversion technologies to distinguish 5mC from unmodified cytosines. In addition to the test probe sets, the arrays include bisulfite conversion quality control probes. In some instances, the analysis software will flag samples for low bisulfite conversion efficiency. Possible causes for these warnings are low bisulfite conversion efficiency, low DNA input/quality, and chip failure.
Validated Protocols
DNA Input & Quality
Low Bisulfite Conversion Efficiency
Epigenetic clock, Zymo leading the way
Is an Epigenetic Clock the Key to Asylum?
A transcript of BBC World Service Radio’s Newsday interview with Keith Booher, PhD, of Zymo Research Corporation about their DNAge® test being used to determine the age of refugees seeking asylum in Europe as minors.
BBC: Could a finger prick test for blood make it easier for child refugees to have their age verified? That’s a question that California scientists have been thinking about. The field is known as Epigenetics and the test involves examining chemically modified DNA to create a sense of how old someone actually is. Keith Booher is a scientist in California and he has been part of the development of this device.
Booher: What we’re simply trying to do is to make an age determination or quantify aging. For example, in forensics cases when the provenance or age of a sample is unknown, we can make that assessment. There’s also some indications that it may be useful for biologically aging someone – so they may have been born 45 years ago, and are 45 years old but based on certain life decision they make – the diet they choose to eat, if they get enough exercise, do they live a stress-free lifestyle? Their biological age may be older or younger than their chronological age, just depending on the lifestyle they lead. And we should be able to quantify that as well.
BBC: So if I asked you now, how old you are, Keith, what would you tell me?
Booher: I’m 38 years old.
BBC: But that’s the chronological age, is that right?
Booher: Correct!
BBC: Which one is more important, biological or chronological?
Booher: You know, if you’re a young teenager trying to get your driver’s license, obviously your chronological age is very important. But if you are in advanced years of your life or you may have made some choices that are… poor when you were younger or over the course of your life, then biological age becomes much more critical.

A Piece of the Puzzle
Epigenetic regulation – in the form of DNA methylation, histone modification, and chromatin remodelling – helps govern the proper expression of genes in the genome. One’s environment continuously shapes their epigenetics. Factors that influence epigenetics can include one’s diet, exercise, stress level, drug abuse, and exposure to toxic pollutants. Failure in epigenetic regulation can result in aberrant gene expression (mutations, deletions, copy number aneuploidies) that contributes to halted neural development 4. Thanks to progresses in Next-Gen Sequencing, scientists have been able to map over 600 human epigenes associated with neurodevelopmental disorders, including autism.

Where There’s a Whale There’s a Way
For example, the age of deceased whales can be estimated using various invasive biopsy techniques, but doing so precludes the monitoring of living subjects over time. Alternatively, researchers attempted to measure the age of live whales using telomeric genetic markers, but those methods suffer from a lack of specificity and too much technical noise. By contrast, a number of recent research articles demonstrated that DNA methylation-based age estimators, commonly referred to as epigenetic clocks, are a highly accurate and technically robust means to measure aging in mammalian species as diverse as mice, canines, humans, and other primates1-3.
A group of researchers in Australia now show that DNA methylation analysis is an effective way to help predict the age of living whale populations, thus providing a new tool to study the demographics of these majestic ocean leviathans.
In their study, Polanowski et al.4 noted the development of DNA methylation-based age clocks and set out to develop a similar test for use in humpback whale (Megaptera novaeangliae) research. They focused on the evolutionarily conserved 5’ regulatory regions of genes whose changing DNA methylation patterns correlated with age. The authors first generated a calibration data set using a cohort of 45 humpback whales originating primarily from the Gulf of Maine and with known ages ranging from a few months up to 30 years. Importantly, the tissue sample source used in the analysis came from minimally invasive skin punch dart biopsies.

Long-Read Epigenetics with Microbiome Standards
CONTROLS FOR DNA METHYLATION ASSAYS
Bisulfite PCR (BSP) is a common methodology used for methylation analysis at single-base resolution. Samples are first bisulfite converted and amplified using bisulfite-specific primers. The PCR products generated are sequenced (i.e. Next-Gen Sequencing, Sanger Sequencing, pyrosequencing) and analyzed to determine the methylation status at every cytosine. However, it is critical that primer pairs designed for BSP amplify both methylated and non-methylated sequences with the same efficiency (Figure 1). Otherwise, any amplification bias can result in skewed methylation levels.
Using methylated and non-methylated DNA controls, BSP primers can be easily optimized (validated) based on following criteria:
- +Specific product amplification
- +Equally robust amplification of both methylated and non-methylated DNA standards
- +When sequenced, the methylated and non-methylated DNA standards should result in nearly 100% and 0% methylation, respectively. If the results deviate from the expected result, this may indicate PCR bias.
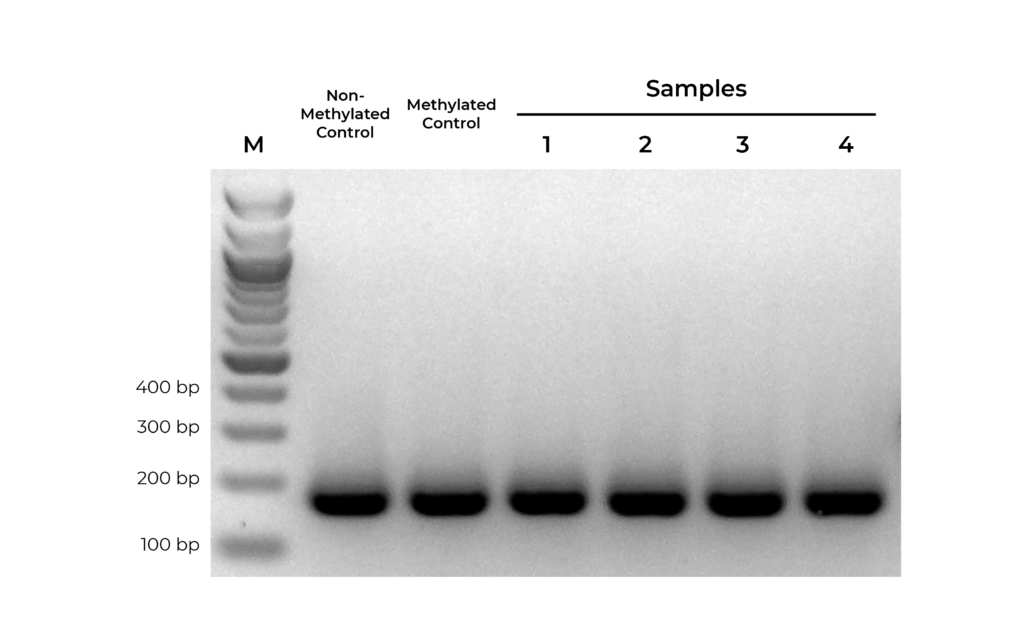
Figure 1. Bisulfite PCR primers should show equally efficient amplification of methylated, non-methylated, or partially methylated templates. Equal amounts of bisulfite converted non-methylated and methylated DNA controls were amplified in parallel with experimental samples using primers designed to target MGMT. Observed bands for methylated and non-methylated templates are of equal intensity, indicating that the primer pair is unbiased.
Unlike bisulfite PCR, methylation-specific PCR (MSP) requires methylated and non-methylated templates to be differentially amplified by two different primer sets. One is a methylation-specific primer set, and if amplification occurs, it indicates the amplified region is completely methylated. The second primer set targets non-methylated templates, so any amplification with this primer set indicates the amplified region is completely non-methylated. If amplicons are generated by both primer sets, the region is partially methylated.
Such two primer sets required for MSP can also be optimized and validated utilizing Methylated & Non-Methylated DNA Controls using following guidelines:
- #Specific product amplification
- #The methylated primer will only amplify the methylated control DNA and will not amplify the non-methylated DNA.
- #The non-methylated primer will only amplify the non-methylated control DNA and will not amplify the methylated DNA.
During primer validation, having characterized methylated and non-methylated DNA standards can streamline the process. For example, if a slight PCR signal is observed using the methylated standard with the non-methylated primers, or vice versa, it would indicate that the primer set is non-specific. For established workflows, especially in clinical assays, methylated and non-methylated DNA standards can serve as positive and negative controls to validate the MSP workflow. Standards will help confirm that the entire process – bisulfite conversion, amplification, and analysis – are functioning appropriately, and the results for the test samples are reliable (Figure 2).
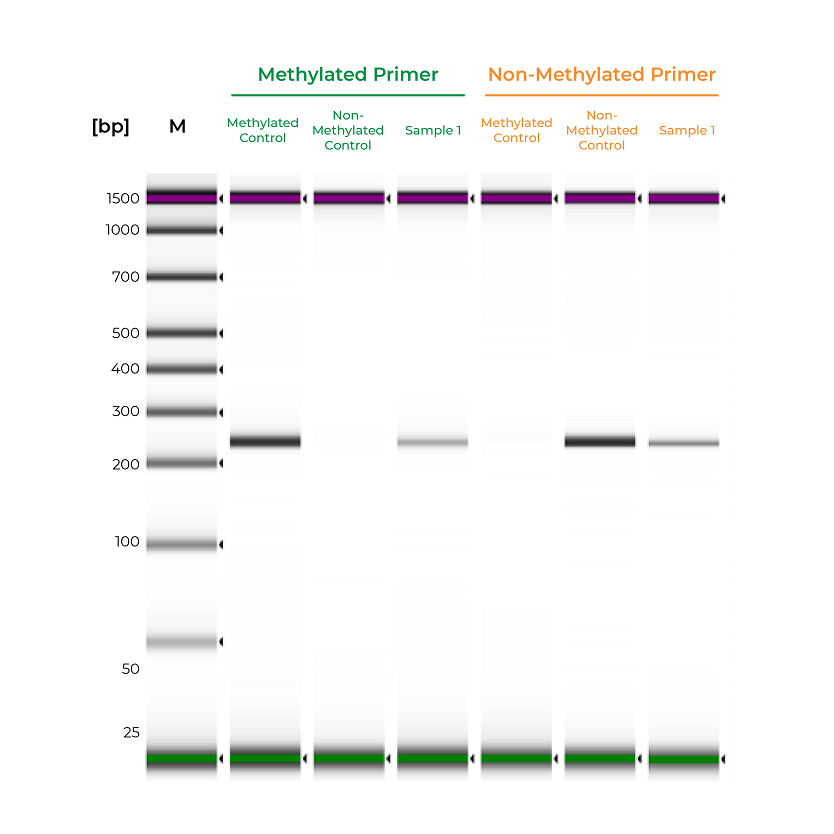
Figure 2. Methylated and non-methylated controls are important for validating the sensitivity of MSP assays. The methylated and non-methylated controls are only amplified by the methylated and non-methylated primers, respectively. Sample 1 is amplified by both primer sets, indicating mixed methylation. Samples were analyzed on the Agilent D100 ScreenTape.
In addition to validating primers, DNA standards can be used in place of precious samples to optimize the annealing temperature for new primer sets (Figure 3). An annealing temperature gradient should be performed for each newly designed primer set to ensure optimal amplification of the intended target.
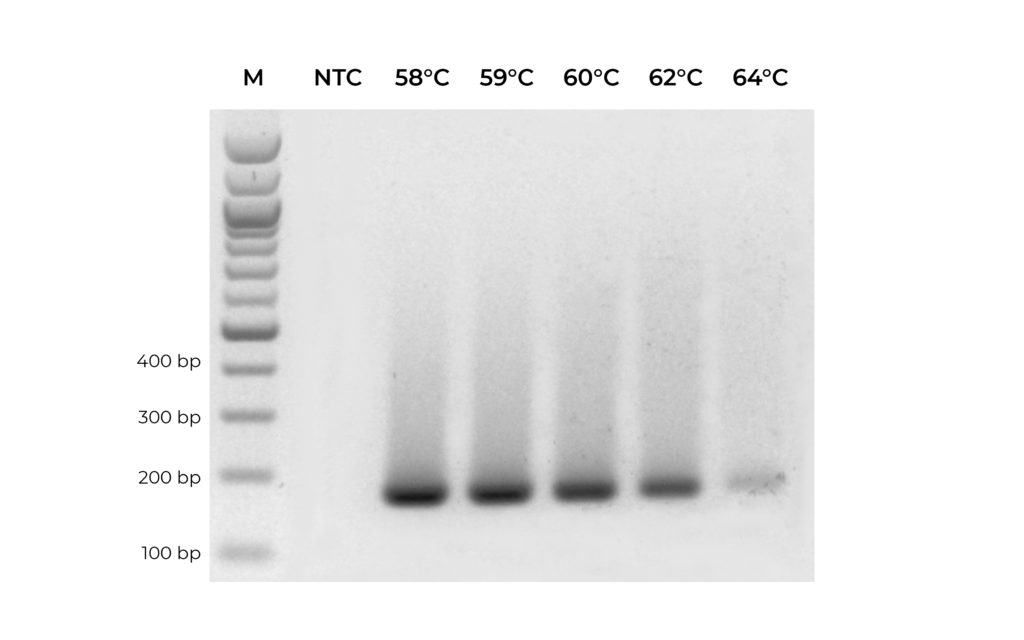
Figure 3. A primer set targeting MGMT was optimized by testing replicate PCR reactions with annealing temperature ranging from 58°C to 64°C.
Methylation sensitive restriction enzyme (MSRE) assays rely on restriction enzymes being able to distinguish methylated versus non-methylated cytosines. If the restriction site is not methylated, the enzyme will digest the DNA while methylated sites will be uncut. Then, methylation at the site can be evaluated using quantitative PCR by comparing the amplification of the digested versus undigested sample. The smaller the ∆C(t) between the two, the higher the methylation levels are, and vice versa (Figure 4). DNA visualization methods, such as an agarose gel, can also be used to determine if the digestion occurred at the region of interest.
Methylated and non-methylated DNA standards should be digested in parallel to experimental samples to demonstrate the robustness of the restriction enzyme in distinguishing methylated versus non-methylated sites. This will also help determine the sensitivity of the assay to the region of interest.
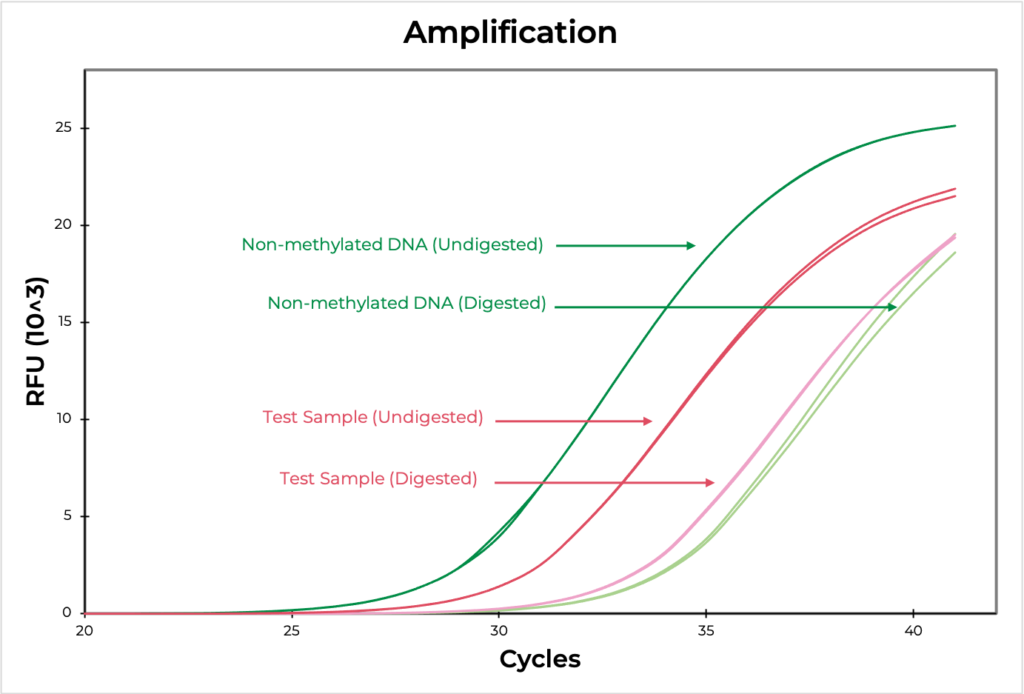
Figure 4. The amplification curve demonstrates the differences in Ct values between digested and undigested samples. The MSRE assay detected 100.9% and 2.7% methylation in the methylated and non-methylated DNA standards, respectively, confirming that the assay worked efficiently. The test sample methylation level was determined to be 17.3.
Are Liquid Biopsies the Future of Diagnostics?
Numerous biofluids such as blood, cerebrospinal fluid (CSF), saliva, amniotic fluid, and urine [4, 6-9] contain readily detectable cfNA populations. However, each of these sample sources produce specific challenges during collection, handling, and extraction that must be addressed to obtain accurate profiles. Cell-free DNA is most commonly isolated from the serum or plasma fraction of blood, however extraction methods must also be able to address a wide range of sample types.
The most readily available methods to collect cfDNA have been restricted to commercially available extraction kits or homemade methods. These methods may not be optimized and often use outdated technologies. Cell-free biofluids are challenging to work with due to their high protein content and low amount of cfNA in relatively large amounts of liquid. This is why traditional cfNA extraction technologies have been so limited in isolation efficiency, sample compatibility, and have been unable to isolate both cfDNA and cfRNA from the same input sample.
To address this issue, Zymo Research produced a revolutionary kit designed to easily process samples from liquid biopsies, all in one quick, simple workflow. The Quick-cfDNA/cfRNA™ Serum & Plasma Kit contains protocols that make it easy to isolate cfDNA from even the most difficult sample types (Figure 1).
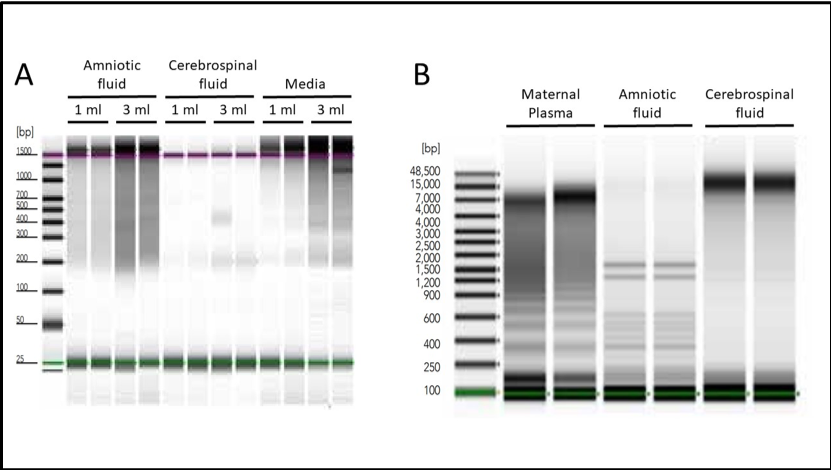
Figure 1: Isolation of cell-free nucleic acids from various sources. A. Amniotic fluid, cerebrospinal fluid, or spent HeLa cell culture media were used to isolate cfNAs using Quick-cfDNA/cfRNA Serum & Plasma Kit. Endogenous cell-free DNA from each sample type was visualized using the Agilent 2200 TapeStation® system. B. Total cfDNA, including both high and low molecular weight species, was purified in duplicate from human maternal plasma, amniotic fluid, and cerebrospinal fluid using the Quick-cfDNA Serum & Plasma kit. DNA was visualized using the Agilent 2200 TapeStation® system.
Another challenge facing cfNA analysis is the robustness of samples when initiated into sequencing pipelines such as RNA sequencing (RNA-Seq). Along with the relatively low amount of nucleic acid, microRNAs are often lost during purification which leads to profile bias. This is can be due to the use of non-optimal extraction methods that produce biased cfNA recovery. For example, three commercial methods of cfRNA extraction from plasma demonstrates difference in the cell-free microRNA yield for hsa-miR-16-5p in the figure below (Figure 2).
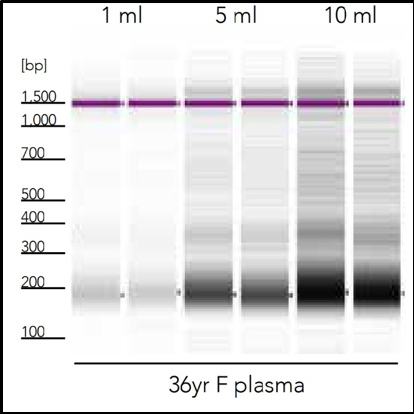
Figure 2: Cell-free DNA recovery scales proportionally with sample input. Cell-free DNA was isolated in duplicate from three healthy female donors using the Quick-cfDNA Serum & Plasma kit and visualized using the Agilent 2200 TapeStation® system.
Another challenge facing cfNA analysis is the robustness of samples when initiated into sequencing pipelines such as RNA sequencing (RNA-Seq). Along with the relatively low amount of nucleic acid, microRNAs are often lost during purification which leads to profile bias. This is can be due to the use of non-optimal extraction methods that produce biased cfNA recovery. For example, three commercial methods of cfRNA extraction from plasma demonstrates difference in the cell-free microRNA yield for hsa-miR-16-5p in the figure below (Figure 3).
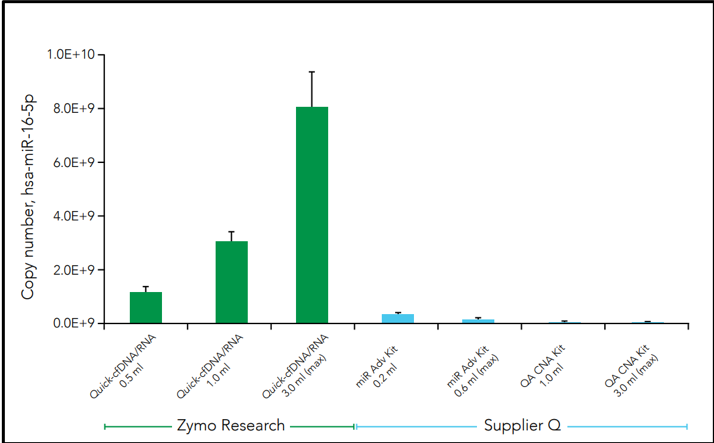
Figure 3: Isolation of human miR-16-5p using commercially available cfNA extraction kits. Samples from the same donor (plasma from 61y-F) were processed using the manufacturers’ suggested protocol and eluted in 30 µl. Quantification of human hsa-miR-16-5p was assayed using the method described by Busk [10]. The yield scales linearly to input volume for Quick-cfDNA/cfRNA Serum & Plasma Kit.
Further comparative analysis of commercial kit cfRNA extracts followed by RNA-seq analysis demonstrates that the Quick-cfRNA Serum & Plasma kit yielded higher quality reads, better alignment to sequence databases, and achieved recovery of 463 additional microRNA species not recovered by the supplier Q kit (Table 1).
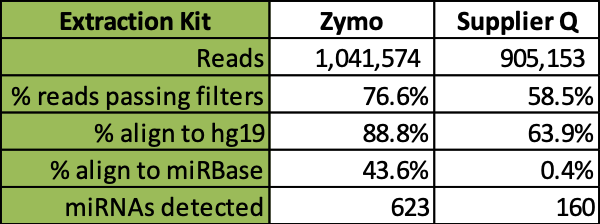
Table 1: Comparison of RNA-Seq analysis of cell-free microRNAs from two commercial kit workflows. Total cell-free RNAs were isolated from 200 µl plasma from each of four different donors. RealSeq-Biofluids Library Prep Kit (SomaGenics) was used to generate RNA sequencing library and ran on MiniSeq System (Illumina). Read averages, quality, alignments, and microRNA diversity quantification are summarized above.